Curro Vs Advtech
3 March 2017 By PDSNETIn the last article we looked at the Price:Earnings Growth ratio as a method which you could use to determine whether a quality blue chip share is cheap or expensive at its current market price. In this article we want to examine the extraordinary case of Curro Holdings which is currently sitting on a PE ratio of 108,77 which makes it one of the most expensive shares on the JSE and one of the most highly-rated.
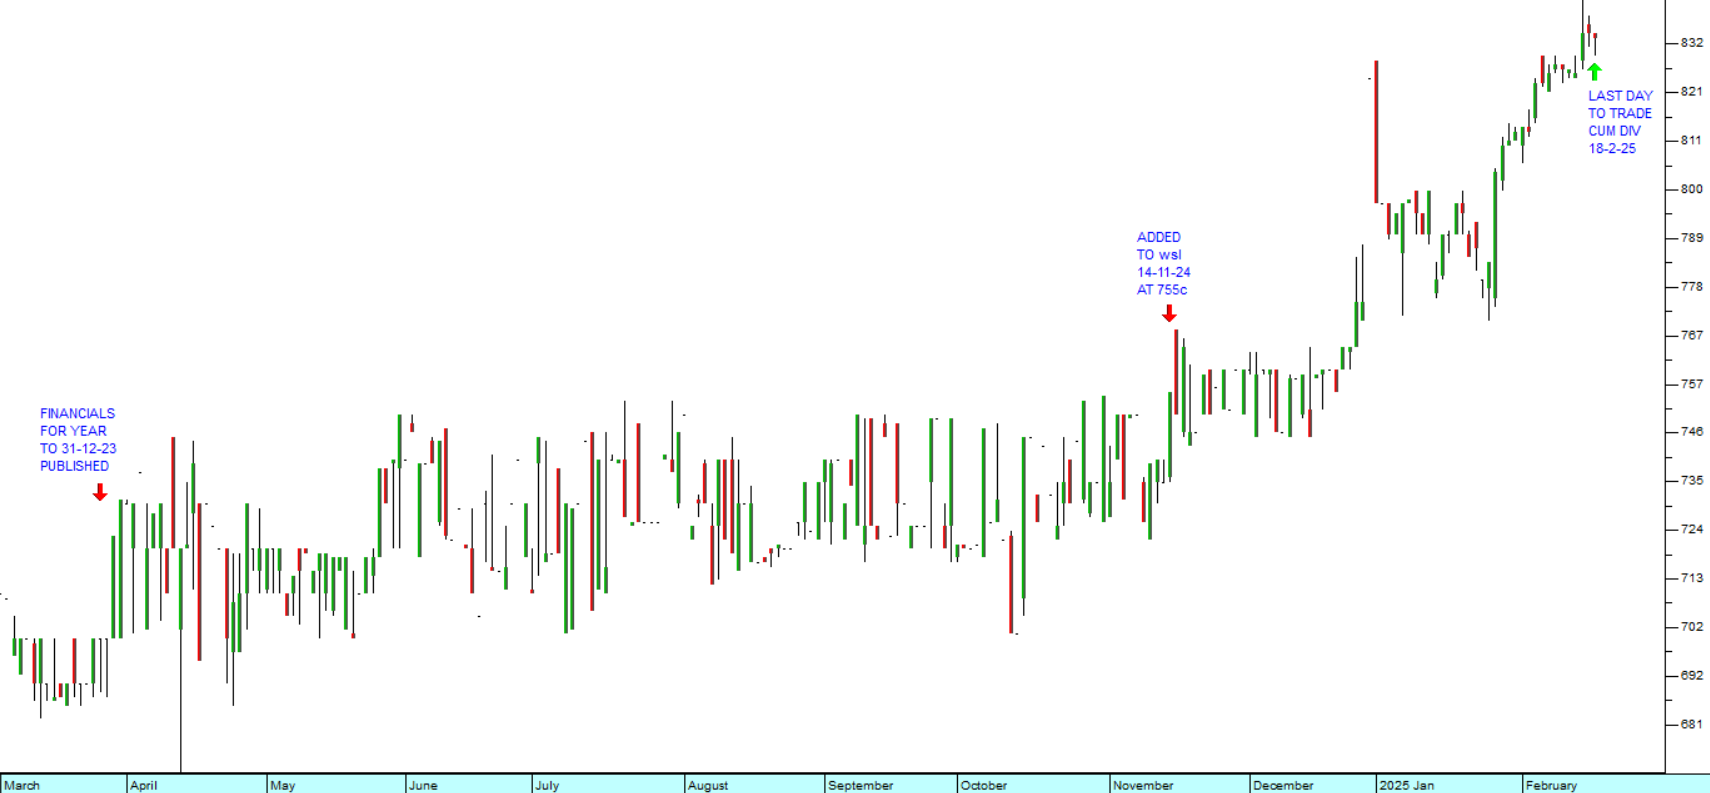
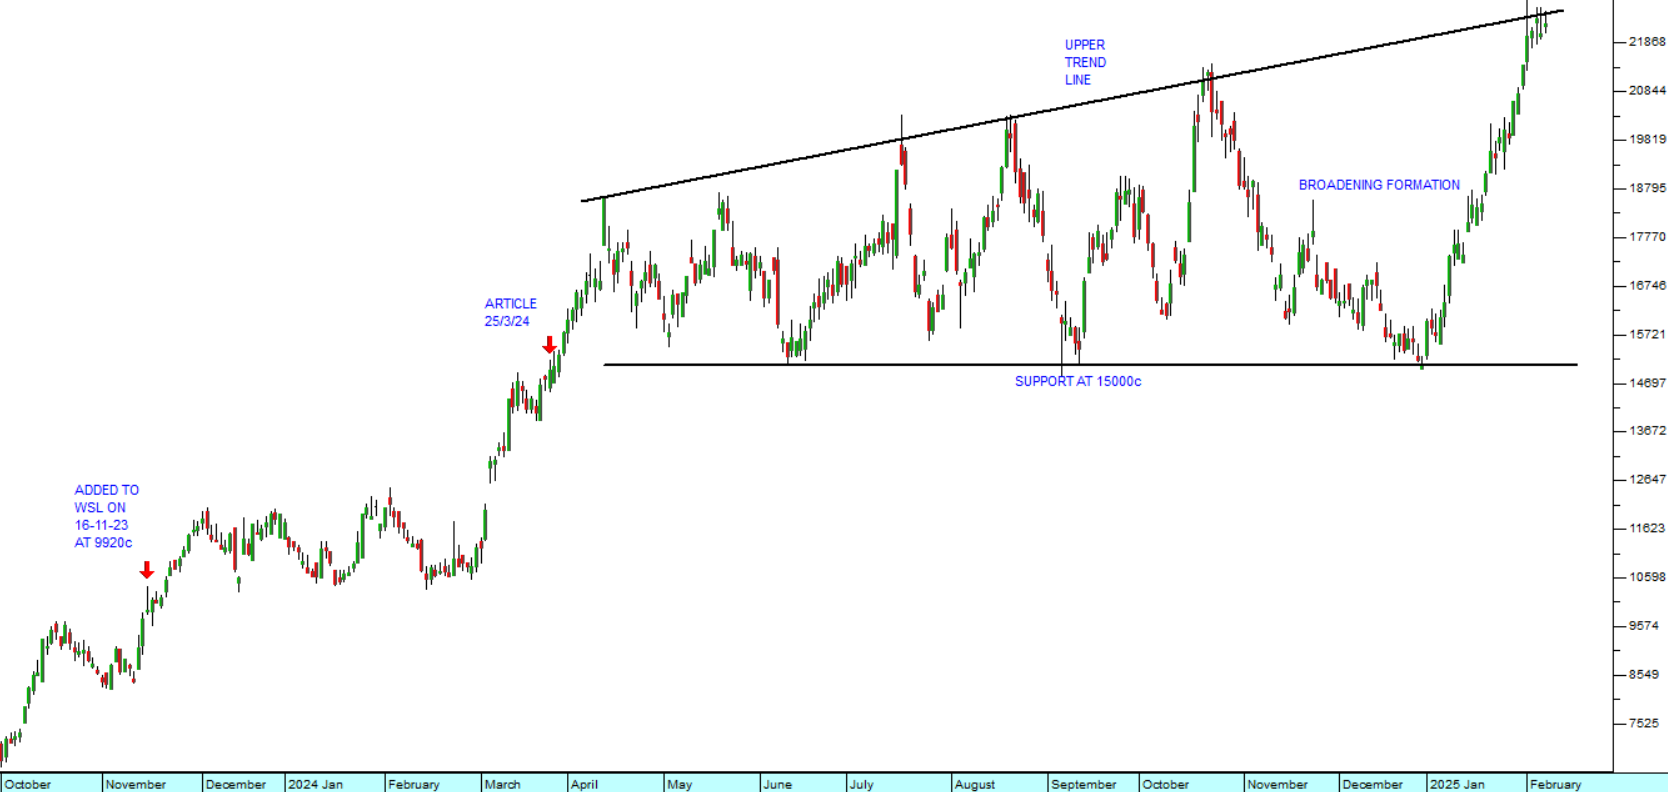
Look at the chart:

When thinking about this share you need to understand that it only plans to pay its first dividend in 2019 according to the CEO, Chris van der Merwe. If we consider its PE Growth ratio for the 5 years that it has been producing profits we get the following:
| Curro | ||
| Year | EPS | EPS % |
| 2012 | 7.1 | |
| 2013 | 12.87 | 81.3 |
| 2014 | 17 | 32.1 |
| 2015 | 27.8 | 63.5 |
| 2016 | 44.7 | 60.8 |
| P:E | 108.77 | 59.4 |
| P:E Growth | 1.83 | |
Its average growth in Earnings Per Share (EPS) has been a very impressive 59,4% per annum compound. Dividing this into its P:E ratio of 108,77 gives a P:E Growth ratio of 1,83 expensive, but not nearly as expensive as some other JSE shares (like Pick n Pay and Naspers). The point is that Curro has enormous blue sky potential. The need for educational facilities in South Africa has grown exponentially as government education has deteriorated. Curro has seen this gap and filled it with alacrity. The only share that we can compare it with is Advtech. That company is also on a high P:E of 29.26 but its track record of growing earnings is far less impressive. Consider the numbers:
| Advtech | ||||
| Year | EPS | EPS % | ||
| 2003 | 13.88 | |||
| 2004 | 10.34 | -25.5 | ||
| 2005 | 15.98 | 54.5 | ||
| 2006 | 22.66 | 41.8 | ||
| 2007 | 32.05 | 41.4 | ||
| 2008 | 40.22 | 25.5 | ||
| 2009 | 40.11 | -0.3 | ||
| 2010 | 37.21 | -7.2 | ||
| 2011 | 39 | 4.8 | ||
| 2012 | 34.4 | -11.8 | ||
| 2013 | 38.54 | 12.0 | ||
| 2014 | 41.29 | 7.1 | ||
| 2015 | 50.2 | 21.6 | ||
| P:E | 29.26 | 13.7 | ||
| P:E Growth | 2.14 | |||
Now you can see that Advtech, although trading on a P:E which is less than one third of Curro's is actually far more expensive at its current price, because its track record of growing earnings is much less impressive, averaging of just 13,7% growth per annum. So that just goes to show that you need to look at the numbers! Both shares are expensive, when compared to other blue chips, but of the two, Curro is definitely the better buy.
DISCLAIMER
All information and data contained within the PDSnet Articles is for informational purposes only. PDSnet makes no representations as to the accuracy, completeness, suitability, or validity, of any information, and shall not be liable for any errors, omissions, or any losses, injuries, or damages arising from its display or use. Information in the PDSnet Articles are based on the author’s opinion and experience and should not be considered professional financial investment advice. The ideas and strategies should never be used without first assessing your own personal and financial situation, or without consulting a financial professional. Thoughts and opinions will also change from time to time as more information is accumulated. PDSnet reserves the right to delete any comment or opinion for any reason.
Share this article: