The Golden Cross
In this article we are going to analyse the bear trend with the ultimate objective of giving you a mechanism which may be helpful to you to determine when it has ended and that you could use to potentially decide when exactly to buy back in at lower levels. Obviously, no technique is completely fool proof. Decisions of this nature in the share market are always a question of probability rather than certainty. Nonetheless, the Golden Cross is a method used by many investors to decide when to buy back into the market or into individual shares.
In quite simple terms, the golden cross occurs when the 50-day exponential moving average (MA) crosses up through the 200-day simple moving average. When this happens, it is thought by some technicians to give a very reliable buy signal.
In our experience, the golden cross event is a good indicator, especially when there is a protracted movement where the share or index rises or falls for a lengthy period of time (i.e., longer than 6 months). The opposite of the golden cross, the reverse golden cross, occurs when the 50-day exponential moving average cuts down through the 200-day simple moving average.
We have repeatedly said that the progress of the S&P500 index gives the best indication of when the markets of the world (including the JSE) are in a bull or a bear trend. This is because it is a weighted average of the five hundred largest companies trading on Wall Street – which are, more-or-less the five hundred largest companies in the world. When Wall Street is in a bull trend then the markets of the world such as London, Frankfurt, Tokyo and the JSE are in a bull trend. The opposite is also broadly true.
Consider this annotated chart of the progress of the current bear trend since it began on 3rd January 2022:
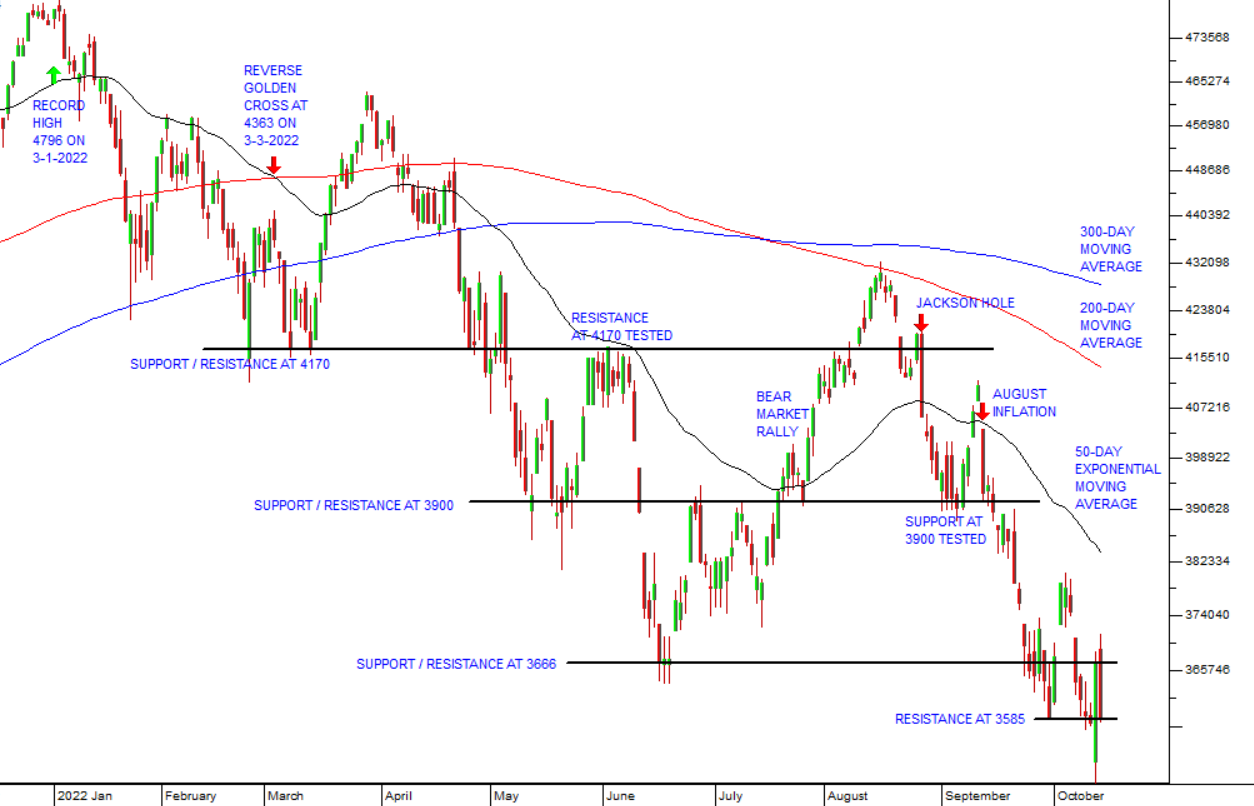
We would like you to note the following points marked on this chart:
- The record high which occurred on 3rd January 2022. This is where the bear trend began – although that only became apparent some months later.
- The four support/resistance levels which have now been established at 4170, 3900, 3666 and most recently 3585. These are levels which the index finds difficulty in penetrating either on the way up (when they are resistance levels) or on the way down (when they are support levels).
- The bear market rally which took place between mid-June and mid-August 2022, and which saw the index rise to recover 58.6% of what had been lost in the bear market at that point. This was an exceptionally strong bear market rally and reflected the excessive optimism which has been a characteristic of this bear trend.
- The 300-day simple moving average shown in blue and 200-day simple moving average, shown in red. Both are long-dated averages and we have said previously that the slope on these averages is a very solid, if somewhat late, indication of the direction of the trend. The 50-day exponential moving average, (black) is a far more sensitive indicator both because it is measured over a much shorter period and because it is exponentially weighted. If you need to refresh your understanding of exponential moving averages, please re-read module 24.
- We have also marked two key fundamental events which impacted directly on the S&P500. The first is the 10-minute speech by Jerome Powell, Chairman of the US Federal Reserve Bank, at Jackson Hole on 26th August 2022 and the second is the publication of the August 2022 US inflation figures on 13th September 2022. Both of these events caused the S&P to fall dramatically.
- We also draw your attention to the candle on Thursday 13th October 2022 when the S&P initially dropped 2,4% from the previous day’s close, at 3577, and then rose to close up 2,6% on the day. This extraordinary 5% reversal was, in our view, a further example of the delusional and excessive optimism which has characterized this bear trend. You will note that the 5% jump encountered and could not exceed the previously established resistance level at about 3666. To anyone following the progress of the S&P, that day’s gain was clearly not sustainable and was completely reversed the next day, on Friday 14th October 2022, when the index closed at 3583 – down 2,37%.
- Finally, the reverse golden cross which occurred on the 3rd of March 2022, at an index level of 4363. While reverse golden crosses have given false signals in the past, this one proved to be one of its most timeous. Since then, the S&P has fallen 17,9% and the 50-day exponential moving average has remained below the 200-day simple moving average, even during the unusually large bear market rally from mid-June to mid-August. We expect that when the 50-day exponential moving average does finally break up through the 200-day moving average it may well give a very accurate indication that a new bull trend is in progress. We believe that event may still be some months away.
As a private investor, it is important for you to have a good understanding of what is happening on Wall Street and why, because what happens there will inevitably impact directly on the JSE and other world markets. The golden cross may not give the best signal of the end of this bear market, but so far it has a good track record in this bear trend, and we believe that you will not be far wrong if you consider it.
← Back to Articles