The Confidential Report - November 2021
America
The S&P500 closed last week on another all-time record high at 4605 which means that the mini-correction of September/October is behind us and investors are now anticipating a Christmas rally. Consider the chart:
.png)
The fears of inflation have been swept aside by the 3rd quarter results of S&P500 companies that are reporting results which are above analysts’ expectations, more than 80% of the time. Big tech companies like Microsoft, Alphabet and Tesla have beaten earnings expectations while energy companies are benefiting from the rising oil price. Only Apple and Amazon produced results below expectations.
In September 2021 the CPI inflation rate in America was 5,4% year-on-year - well above the Federal Reserve Bank’s target of 2% and more than the August figure of 5,3%. Notably, food which jumped 0,9% in the month and rentals which increased 0,4%, accounted for more than half of the rise – which means that US consumers are beginning to be squeezed. A major problem appears to be supply chains which are constrained and battling to keep up with a world-wide post-COVID-19 surge in demand. Overall, the central banks around the world have applied more than $10 trillion of stimulus since COVID-19 – with roughly half of that in America.
The Fed thinks that inflation will come down in both 2022 and 2023 and that they will only need to begin increasing interest rates in 2023. They justify this because unemployment levels remain high after the pandemic. The unemployment rate is still about 5m above what it was before COVID-19. The pre-COVID-19 level was considered to be “full employment” – a point at which the shortage of labour in the economy causes wages to rise resulting in increasing inflation.
For these reasons, the Fed is maintaining its “dovish” stand and allowing the bull market in shares to continue. But, what if the Fed is wrong about inflation and it persists at the current high levels or even increases? September was the 5th month where inflation was above 5%. If they are wrong, then they will need to raise interest rates more rapidly. We think that this scenario, or at least the fear of this scenario, will result in a major correction fairly soon. Some economists are already saying that the inflation in the US can no longer be considered “transitory”.
Into this scenario must be added the fact that North Sea Brent oil is now trading at over $84 per barrel and rising. The Western world is about to enter winter which is usually associated with rising demand for energy and thus rising oil prices.
Second quarter 2021 growth in the US economy was an amazing 6,7%, but economists are now expecting growth in the third quarter to be as low as 2%. These figures show the American juggernaut is still growing at a very high rate pushed by massive government stimulation.
Since all the markets of the world, including the JSE tend to follow the S&P500, it is periodically worth stepping back from the detail to look at the long-term context of the index. As we all know, the S&P has been in a protracted bull trend for twelve-and-a-half years, a post-World War II record. This massive rise in share prices has been extended and maintained by continuous central bank stimulation in the form of ultra-low interest rates and quantitative easing, especially in America. Consider the chart:

There are several points to note in this chart. The first is that it is a semi-logarithmic chart which can be seen by examining the scale on the Y-axis. If the chart were linear, you would see that the rise is becoming exponential – especially following the COVID-19 induced V-bottom in March 2020.
The second point is that the index has been moving between two clearly defined channel lines. In the above chart, the lower channel line is defined by the low of 666 in the index in March 2009 and by the low of 2237 made in March 2020 because of the COVID19 V-bottom.
The upper channel line is supported by at least 7 touchpoints (6 of which are identified by the red arrows) which makes it extremely reliable from a technical perspective. It is a remarkable vindication of technical analysis that the two channel lines, both upper and lower, are parallel over such an extended period.
We have for some time now been drawing attention to the ten “mini-corrections” of less than 10% in the S&P500 which have occurred in the 20 months since the COVID-19 V-bottom in March 2020. We have suggested that these would surely be followed by a major correction of between 10% and 20%.
The above chart clearly supports this idea, because, following its new record high of 4605 on Friday the 29th of October 2021, the index is sitting exactly on that upper channel line – which implies that the next broad move will probably be down towards the lower channel line. The problem is that the chart does not really tell us when that will happen – but, now that October month is behind us, we expect that it could come early next year, once the Christmas rally is over.
How far could it fall? Based on the chart above, we believe that it will be a fall of between 460 points (10%) and 920 points (20%). A 20% fall will take the index back to its lower channel line at around 3680. We also believe that it is highly unlikely to break below that lower channel line and that the correction, when it materializes, will offer an excellent buying opportunity.
Political
Unless there is an outbreak of crime or violence during the election, such as the civil unrest in July, we do not expect the outcome to have much impact on listed companies. It appears that the most enduring result is likely to be a drop in the ANC’s support from over 57% to below 50%, mainly because of a drop in voter turnout. The impact may be larger because of the recent power cuts and loadshedding. The major centres, like Johannesburg and Tshwane (Pretoria), look set to be governed by some sort of coalition. Once the election is over the government will again feel able to take less popular decisions more freely, which could lead to further economic reforms.
Since the advent of the Ramaphosa administration the ANC has definitely moved much closer to the policies generally espoused by the DA. In this way it has won some of the DA’s more left-wing supporters and lost some of its more populist supporters to the EFF. However, the shift in ANC policies has made coalitions with the DA following this election more practical and probable, especially in those metros where an outright winner does not emerge.
Economy
South Africa’s inflation rate (the consumer price index or CPI) rose to 5% in September as a result of rising food, housing, and utility prices. To this must be added the forecast that the fuel price may well rise to R20 per liter by the end of 2021. In addition, international inflation is creeping up as a result of supply chain bottlenecks. All of this makes an interest rate hike more probable when the monetary policy committee (MPC) meets in November. We now expect rates to be increased by 0,25% in November – mainly because of the oil price. A strengthening rand could counter this.
Three forces are at work to increase inflation here in South Africa. They are:
- The oil price has been rising steadily for some time causing the local price of petrol to rise which will in time force manufacturers to raise prices.
- The price of food has been rising faster than the inflation rate and threatens to increase the CPI in coming months.
- The level of world inflation is rising partly because of post-COVID-19 supply constraints and that will feed through to South Africa sooner or later.
These factors may cause the monetary policy committee (MPC) to raise rates sooner than expected, perhaps even in November 2021.
The unexpected jump in the producer price index (PPI) in September was about half a percent above economists’ predictions of 7,3%. It was mainly a result of rising fuel and food prices. It obviously raises the chances that the monetary policy committee (MPC) will raise interest rates at their meeting in November. This is also consistent with rising inflationary pressures worldwide. Ultimately, the central bank's response to rising interest rates will bring the current bull trend in equities to an end, once they begin raising interest rates consistently.
Lesetja Kganyago, the Governor of the Reserve Bank, has drawn attention to the fact that South African companies are sitting on about R1 trillion, because they lack confidence in the economic environment. Companies hoard cash when they feel uncertain about the environment, especially the law. If there was legislative certainty, much of that capital would be invested in projects which would have a massive impact on the economy and job creation.
South Africa’s terms of trade (TOT) has improved dramatically from 102,3% in January 2019 to 131,9% in July 2021. Most of this improvement is due to the rise in commodity demand and pricing. The TOT shows the country’s exports as a percentage of its imports so in July the country exported almost 32% more than it imported – which obviously leads to a current account surplus and helps the rand counter the international risk-off sentiment which has dominated markets in the past few weeks.
The TOT can be viewed at: Tradingeconomics: terms-of-trade
The cost of the strike in the metal workers sector of the economy was R600m worth of lost production and at least R300m in lost wages. The union has now accepted a revised offer of a 6% increase by employers after 8 days on strike. The strike had knock-on effects, notably in the motor vehicle manufacturing sector where BMW alone has said that it had lost production of about 700 vehicles in one day. The sector is desperately struggling to recover from the impact of the pandemic and the civil unrest in July. Clearly, some companies will not survive this strike which will lead to further job losses. As we anticipated, the strike was relatively short, and the final settlement is not far above the current inflation rate – indicating that high unemployment rates and the weakness of the economy have eroded union bargaining power to some extent.
The sharp 57% drop in vehicle exports during September 2021 was mostly a result of July’s civil unrest, but also due to the international chip shortage and various plant closures. Vehicle exports are one of South Africa’s economic successes, employing thousands of people and generating important foreign currency. The industry is also periodically beset by union action, such as the recent metal workers strike, which threatens its effectiveness and competitiveness on world markets. Despite this, it remains a fine example a government-supported beneficiation program where instead of exporting raw materials and importing finished goods we can produce finished goods locally and export them to the rest of the world.
The latest government buzzword is “localisation” which means making taking steps to encourage the purchase of locally produced products over imports. The government recently issued a directive that government departments had to buy locally produced cement even if imported cement is cheaper to protect the local cement industry. The local cement industry has been negatively impacted by cheap imported cement, especially from Pakistan. It is expected that other “localisation” policies will follow. The policy is regarded as a type of protectionism which can have the effect of increasing prices and can also spark retaliation by South Africa’s international trading partners. To counter the price increase concerns, the Department of Trade and Industry is now saying that the competition authorities will monitor and control price increases if necessary. The problem with this is that both localisation and controlling prices amount to an interference in free-market economy – and economists agree that any such interference incurs a cost which usually manifests in the form of inflation.
An overseas delegation, which includes the US, UK, Germany and other countries, is working to establish a plan for an energy transition in South Africa away from coal-based generation and is hopeful of a successful outcome. The idea is to have a plan in place before the conference of climate change (COP26) which begins in November. Ideally, these first world countries will finance the building of renewable energy systems which will make between 7 and 9 of our coal-fired power stations redundant.
The inefficiency and high cost of South African ports combined with the continuous breakdowns on the rail network are estimated to have cost the country around R30bn. Now Transnet is applying for a tariff hike of 24%. Our ports are already among the most expensive and least productive in the world leading to many ships by-passing South Africa and using alternative ports. Obviously, the major impact of these inefficiencies has been in the mining industry which has been prevented from exporting as much as it would have. That in turn has reduced their profitability and the country’s tax revenues.
The application by Business Unity South Africa (BUSA) to obtain a declarator on the issue of companies insisting that their employees be vaccinated is essential. Several large companies, notably Discovery, Mediclinic and Life, have already made this ruling, as have several universities. Some employees are now refusing to work with unvaccinated people. Large companies are suggesting that the employees of small companies that they do business with will not be allowed to come on to their premises without a vaccination certificate. Life for the unvaccinated is becoming increasingly difficult – a fact that will, in time, persuade all but the most extreme anti-vax people to obtain their vaccination.
The Rand
The impact of Monday’s election on the rand has been noticeable. Usually when the S&P500 is breaking new record highs it signals that international investors are moving back towards “risk-on” – and that is usually good for emerging market currencies and especially the rand. Over the past seven trading days, however, international investors have been getting increasingly positive about Wall Street, but sentiment has turned significantly against the rand. It has fallen by 5,6% as the S&P has risen 1,5% to a new all-time record high. The problem lies with the election. International investors fear that Ramaphosa’s ANC is going to lose substantial ground, probably coming in below 50% for the first time, which will force it to make coalitions with other parties. This loss of support is seen as a blow to Ramaphosa’s economic reforms and so is negative for the rand. Consider the chart of the rand against the US dollar:
.png)
This chart shows the long-term strengthening trend in the rand since April 2020. It reached a cycle high at R13.43 to the US dollar on 4th June 2021 and then began to weaken. That weakening was initially caused by the mini-correction on Wall Street and then by the cabinet re-shuffle which saw Finance Minister Tito Mboweni replaced by Enoch Godongwana. Once the market had digested these developments, the currency began to strengthen again until it became apparent that the elections might not have the anticipated outcome. In our view, the sell-off in the rand has been over-done and the currency should begin to strengthen again once the election is behind us. The rand found support at R15.33 on 20th August 2021 and has returned to touch that level on Friday last week. Hopefully, the results of the election will support the continuation of Ramaphosa’s economic reforms, and the rand will continue its long-term strengthening trend.
General
Bitcoin has hit another new record high on Wednesday (20-10-21) of $66833 per coin – up 5,4% above the previous record high of 63423 (13-4-21). This was probably the result of the launching of an exchange traded fund (ETF) in the United States which focuses on cryptocurrencies. As we have previously said, because cryptocurrencies have no fundamentals, their price performance can only be evaluated technically. In the light of that, the new record high constitutes a "rising top” which is traditionally bullish. However, since the top, the price has fallen quite sharply on profit taking. Our view remains that cryptocurrencies are highly speculative and likely to remain volatile. We do not consider them to be investments.
.png)
COVID-19 infection rates have been falling steadily, while vaccination rates have been rising. This has led businessmen and investors to believe that the pandemic is largely behind us. With the boom in commodity prices, the economy is gradually recovering. One potential problem is the possibility of a 4th wave based on a new variant which is expected to commence in November or December – maybe as a result of the election process. In our view, this possibility becomes less and less likely with each passing week, especially considering that we now have more than 22 million people vaccinated in South Africa and worldwide infection rates are falling.
Commodities
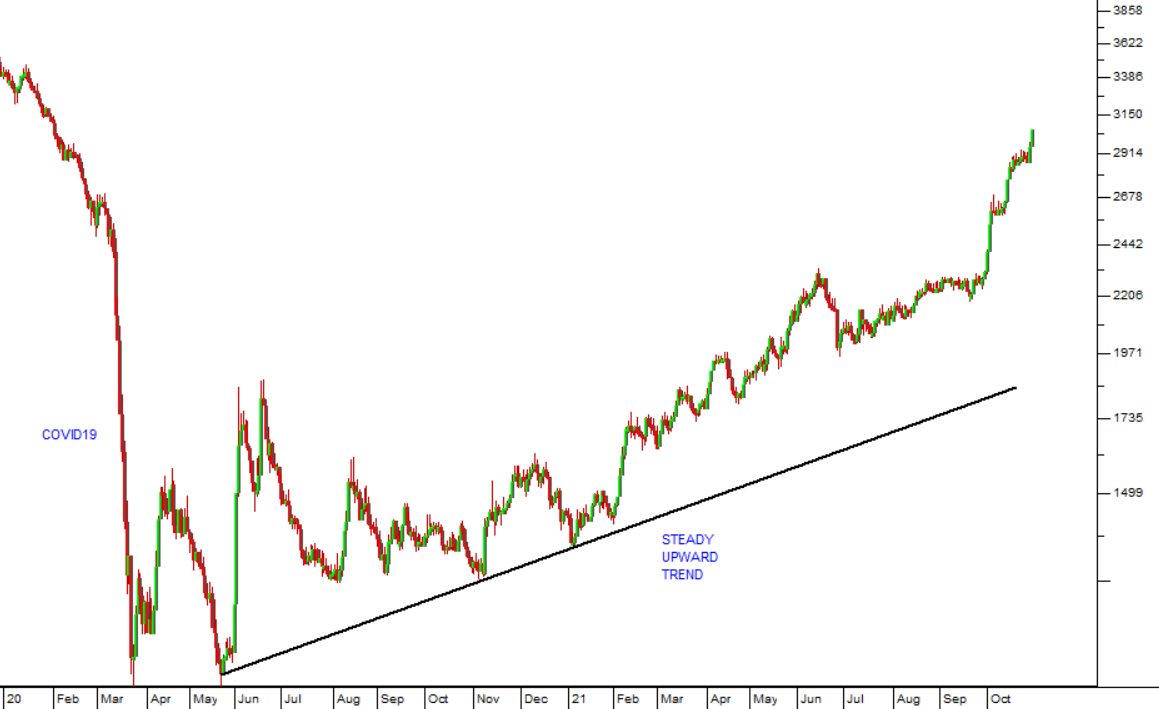
OIL – The price of North Sea Brent has been rising steadily within a channel and has now reached $85. Stockpiles in the Organisation for Economic Co-operation and Development (OECD) are at the lowest levels they have been since 2015. As the world economy recovers from COVID-19 and the level of vaccinations rises, economic growth is increasing, resulting in increased demand for oil and other commodities – notably gas and coal. This, of course, is good news for South Africa which relies heavily on the export of commodities for foreign currency and tax revenue. In our view, the world economy, led by America, will continue to grow rapidly as the impact of quantitative easing, massive fiscal stimulus and ultra-low interest rates take effect. Consider the chart:
.png)
Companies
SMALL CAP
Since the downward spike caused by COVID-19 in March 2020, the JSE’s Small Cap Index has been outperforming both the JSE Overall index and the JSE Mid-Cap index. Consider the chart:
.png)
Here you can see the Small Cap Index in the upper part of the chart and a relative strength of the small cap against the JSE Overall in the bottom half. Since the March 2020 low, the small cap index has more than doubled the performance of the Overall index showing that the smaller companies on the JSE have recovered much more quickly than the heavy-weight blue-chips.
TOURISM
The prospect of being removed from the UK’s “red list” has boosted tourism and accommodation shares on the JSE. City Lodge jumped on the news in anticipation of a flow of tourists from the UK. We believe that City Lodge is underpriced at current levels and will recover as the economy and tourism recover. Most hotel companies are seeing very gradual increases in occupancy but have had to downsize and undertake highly dilutive rights issues at very disadvantageous share prices to bolster their balance sheets. Consider the JSE’s Travel and Leisure index:
CONSTRUCTION
The government’s “indigenisation” policy was launched in a letter by Treasury requiring all government departments to buy only South African manufactured cement products from 4th November 2021. The effect on PPC shares was dramatic with the share closing up 9% on the day, but it is evident that the news had already been exploited since PPC shares have been rising strongly for the past three weeks prior to the announcement. This means that government departments will now be forced to use the more expensive locally produced cement which will increase their costs on the 55 “strategic infrastructure projects” recently announced by government. There is also the strong possibility that this policy of indigenisation could also be applied to other related industries – like the tiling industry – which could impact on shares like Italtile. In general, however, it is a move away from a free-market economy and towards protectionism which might see our trading partners respond in like manner. The JSE’s construction index (JS5011) now consists of only 6 shares (M&R, Raubex, Aveng, Afrimat, WBHO and PPC) all of whom have seen their market capitalisations fall enormously over the past few years. Consider the chart:
As you can see the index reached a low point in March 2020 with the pandemic and has been recovering well since then. In our view, construction shares offer a buying opportunity and should perform well in the coming months.
THUNGELA
The progress of Thungela since it listed on the JSE on 7th June 2021 has been nothing short of spectacular. This is a thermal coal mining company which was spun out of Anglo American because of their policy not to be involved in the coal industry. Coal is a pariah industry because of its contribution to global warming and its carbon emissions. But the price of coal is strong on world markets and Thungela has some excellent mines and solid contracts. The company employs 7525 people and is the leading South African thermal coal producer. The company owns 50% of Phola and operates the Phola coal processing plant. It also has a 23,22% interest in Richard Bay Coal Terminal (RBCT). The company runs and operates 7 collieries at Zibulo, Greenside, Goedehoop, Khwezela, Mafube, Isibonelo and Rietvlei. The share listed at 2500c, fell to 2190c on stagging and has now moved up to about 7271 in just over 4 months. In its financials for the six months to 30th June 2021 the company reported revenue of just over R10bn with headline earnings per share of 305c. The CEO, July Ndlovu, said, “Our operating profit of R990 million and Adjusted EBITDA of R1,888 million demonstrate our ability to operate profitably notwithstanding the ongoing pandemic”. In our view, the share looks fairly fully priced now – but it was certainly an opportunity that most investors missed.
.png)
CALGRO M3
This is a company involved in large-scale, low-cost housing projects and the building of funeral parks. In its results for the six months to 31st August 2021 the company reported revenue up by 45,6% and headline earnings per share (HEPS) up by 262,8%. The company's net asset value increased by 6% to 722,94c which should be compared with its price of 500c. The company said, "The gross margin reached a four-year high of 19.7%, justifying the strategic decision to close and outsource the construction element of the business. Overhead costs decreased by 23%, demonstrating the Group’s ability to manage costs and efficiencies in the current economic environment. Memorial Parks also played its part and produced an increase of 52.7% in cash receipts". Technically, this company made an impressive triple top formation with tops at 2350c in August 2015, December 2015 and May 2016. After that it fell steadily until April 2020. Subsequently it formed an "island" at between 210c and 270c. We suggested that you wait for it to break above its long-term downward trend line. That break came on 24th August 2021 at 272c. The share had moved up to 510c on the 19 October 2021 - a gain of 87.5% in just over 2 months.
.png)
M&R
Murray and Roberts (MUR) was a large South African construction company which has suffered from the sub-prime crisis and then the slump in construction spending following the 2010 World Cup. This brought the share down from a massive double-top formation at around R100 per share to a low below R5 in May 2020. The company has been consolidating and reducing costs. It has transformed itself into a "multinational engineering and construction Group focused on the natural resources market sectors" with three primary business platforms - underground mining, oil & gas and power & water. In its results for the year to 30th June 2021 the company reported revenue from continuing operations up 5,3% and headline earnings per share (HEPS) from continuing operations of 16c compared to a loss of 88c in the previous period. The company's order book rose to R60,7bn from R54,2bn in the previous period. The company said, "Over the next three years, the Group expects most of its revenue to be derived from its two international business platforms, which have established credible positions in regions and sectors with sustainable growth prospects". We advised investors to wait until the share broke up through its long-term downward trendline before investigating further. That upside break occurred at the beginning of January 2021 at a price of 809c and the share is now trading for 1395c - a gain of 72% in about 9 months.
.png)
HULAMIN
Hulamin (HLM) is a producer and supplier of aluminum products in South Africa and trades in more than 50 countries internationally. It supplies foil, heat-treated plate as well as standard coils and flat sheet which represents 22% of Hulamin sales. Like any commodity share, Hulamin is subject to rapid changes in the price of its commodity which are generally outside of its control. In its results for the six months to 30th June 2021 the company reported sales volumes up 44% and revenue up 50%. Basic headline earnings per share (HEPS) was 15c compared with a loss of 70c in the previous period. The company said, "Both Rolled and Extruded Products continued their turnaround actions. These include improvements to capacity utilisation, cost management, tight controls over working capital and a focus on sales growth and distribution. Hulamin Rolled Products sales increased by 43% and Hulamin Extrusions sales by 58% compared to the same period in 2020". On 14th October 2021 the company published a cautionary. In our opinion on Hulamin, updated on 3rd September 2021, we said: “What is noteworthy about this share is that it has a net asset value (NAV) which is more than 3 times its current share price making it a possible takeover target”. The share price had been moving up on higher volumes immediately prior to the announcement indicating some insider trading. Consider the chart:
.png)
The top chart is a candlestick of the share’s price movements, the middle chart is an on-balance-volume (OBV) chart and the bottom chart is a volumes histogram. You can see the long-term downward trendline in the top chart which culminated in an “island formation” between April and November 2020. Then in December 2020 there was a clear upside breakout at 150c per share. More recently there has been an OBV buy signal which came just before the cautionary. The share is now trading at 415c.
← Back to Articles