The 16 Year Bull Trend
Since the Second World War, the stock markets of the world, including the JSE, have always tended to follow the New York Stock Exchange (NYSE) - and the NYSE is best measured by the S&P500 index (S&P) of its 500 largest companies.
For this reason, we believe it is important for private investors to constantly watch the S&P closely to determine whether it is in a bull or a bear trend. In our view, the S&P has been in a bull trend since its low on 9th March 2009 – just over 16 years ago. This is because, in our view, neither the COVID-19 downward spike of 2020 nor the 25% “Ukraine” correction of 2022 have halted the underlying bull trend. Consider the chart:
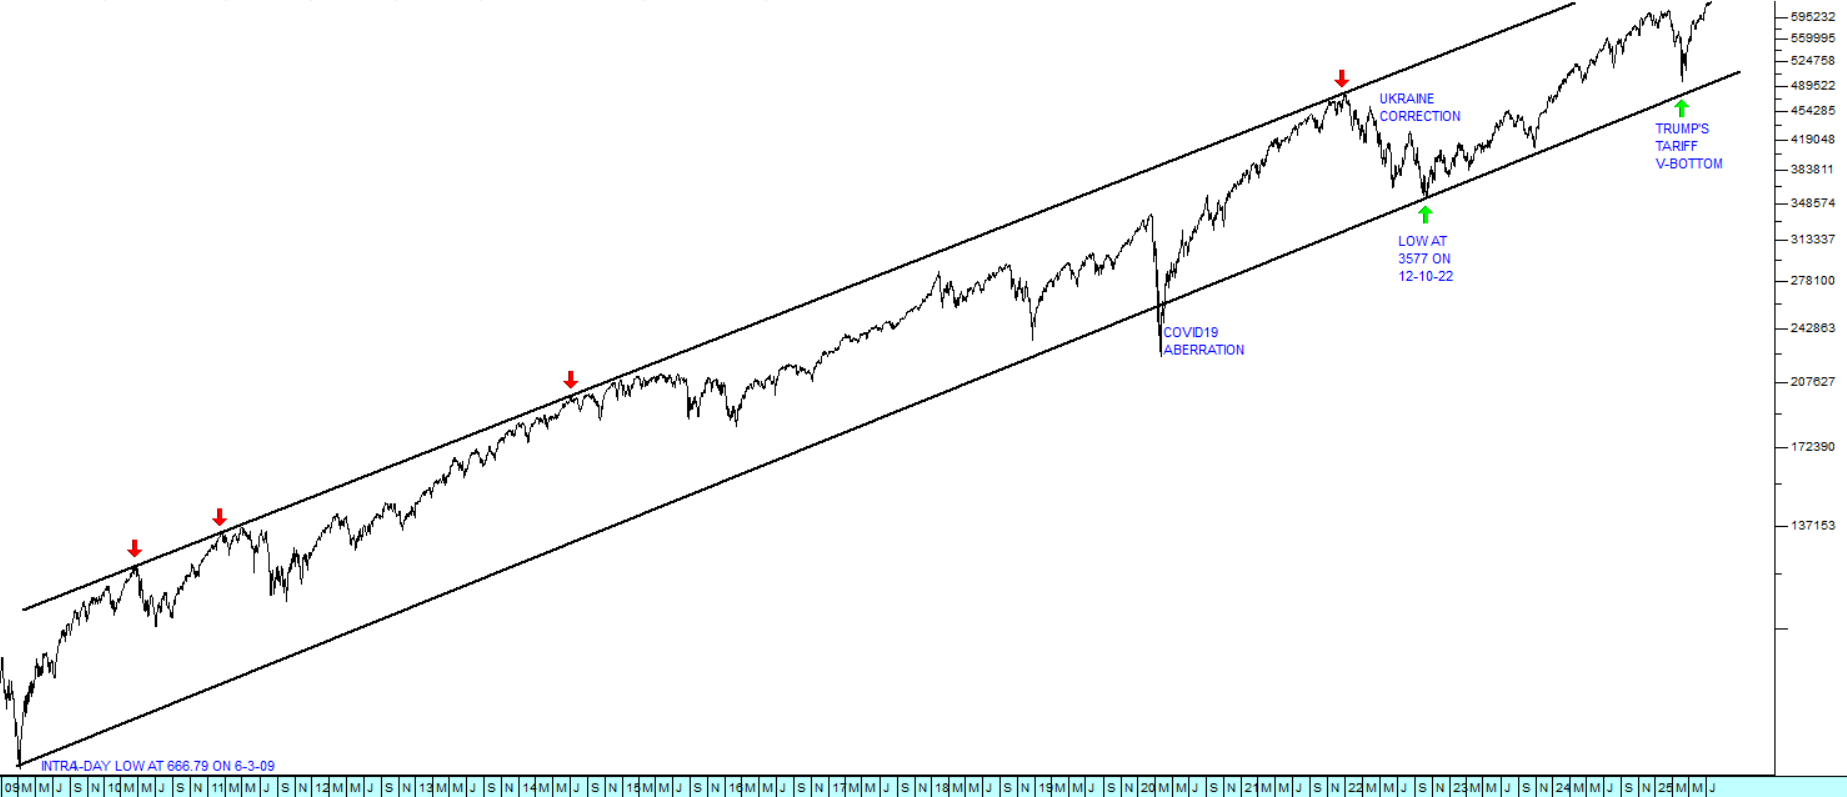
This chart is a semi-log chart going back to the beginning of 2009. It shows the great bull trend, beginning from its intra-day low of 666.79 on the 6th of March 2009 and rising between upper and lower parallel channel lines. You can see the touch points connecting the upper channel line (red arrows) as well as the COVID-19 downward spike and the 25% correction of 2022 which was caused by the outbreak of war in Ukraine.
You can also see the recent V-bottom correction caused by Trump’s on-again, off-again tariffs. We always believed that this latest correction would be a V-bottom because, like COVID-19, its cause was extraneous (rooted in Trump’s absurd and unsustainable tariff policies) and not anything happening in the US economy itself.
The bull trend is being driven by the massive and, as yet unrealised, productivity potential of AI, humanoid robotics and the decline in the cost of energy. As we have now seen, Trump’s antics are just a sideshow and a temporary distraction from these overriding bullish forces which continue to gather momentum.
We expect the S&P to pay less attention to what Trump does or says in the future. In fact, we advise investors to expect that the S&P will rise to touch the upper channel line and reach further new record highs in due course. On 25th January 2024, 18 months ago, we tweeted that “...our calculations indicate that it will reach 6458 some time in the next two years.” At the time the S&P was trading at 4894.
On Thursday last week, the S&P closed at a new record high of 6297 – just 2,5% below that prediction. We believe that it will break above that predicted level very soon and we believe that prediction will be proved to be very conservative.
And the JSE will continue to follow Wall Street up. On Friday the 18th of July 2025, the JSE Overall index closed at a new record high of 98687 – which means that it has risen by one third since we made that prediction, in the tweet mentioned above in January 2024. Consider the chart:
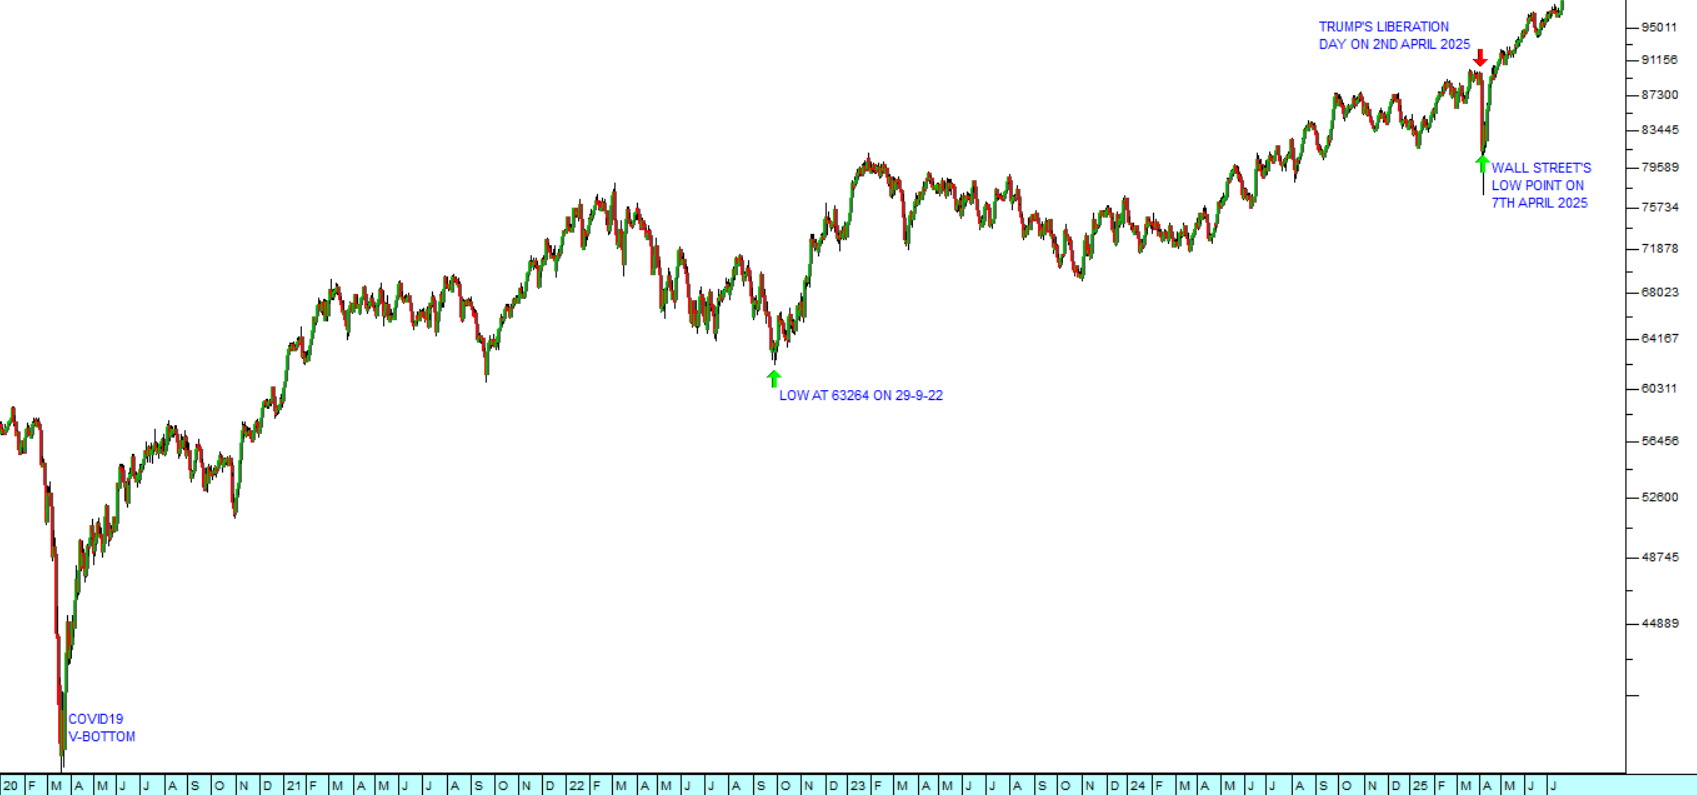
The chart shows the progress of the JSE Overall index since the beginning of 2020, including both the COVID-19 V-bottom and the Trump tariff V-bottom. It also shows the low point reached on the 29th of September 2022, following the Ukraine war correction. It is interesting that the JSE was never really much impressed by Trump’s tariffs and never really believed that they would result in a prolonged downward trend.
We now expect the JSE to continue making new record highs for the rest of this year, into next year and beyond. There will undoubtedly be more corrections in this upward trend, but the bull market itself will remain in tact for the foreseeable future.
For this reason, we believe that investors should be fully invested in equities at the moment. In the June 2009 edition of Profile Media’s Stock Exchange Handbook, I described that time as “The Greatest Buying Opportunity this Century”. At the time the S&P was at about 880 and it has since gone up over 780%. Over the ensuing 16 years I have seen nothing to change that view.
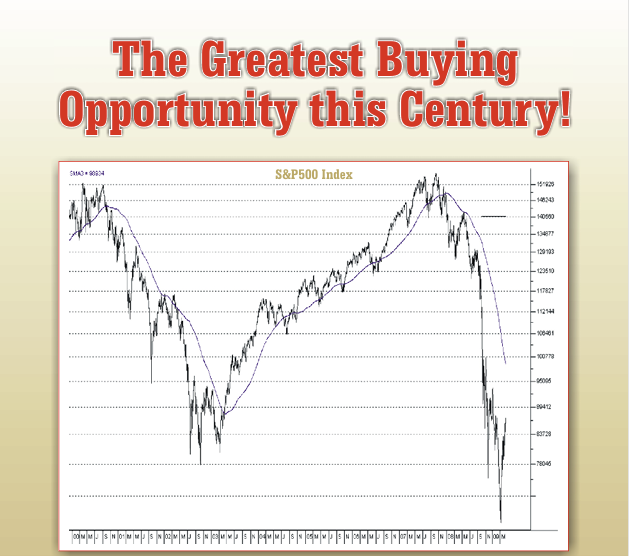
You will note that I did not say the greatest opportunity of the year or even the decade, but of the century – so I still think that this bull market has a considerable distance to run.
← Back to Articles