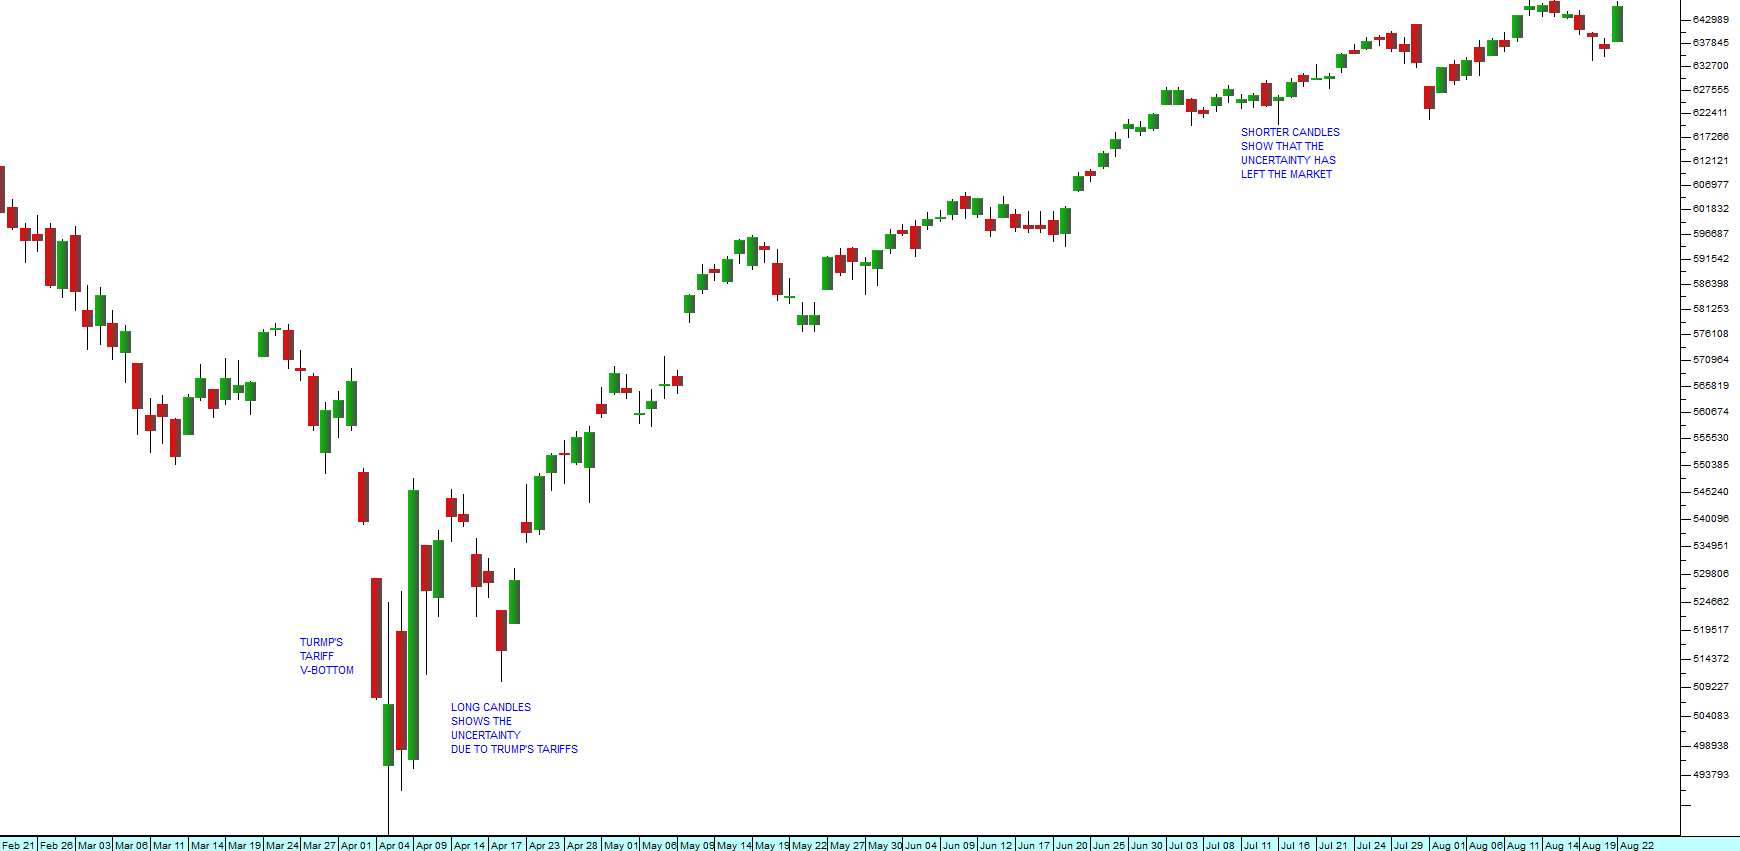
Linear vs Semi Log

11 April 2022 By PDSNET

Most charts of share prices or indexes that you will come across are linear. The date is measured on X-Axis (horizontal) and the price or index level is measured on the Y-Axis (vertical). For short term charts linear scales are fine, but the longer your chart, the more misleading a linear chart becomes, especially for data streams which generally increase over time.

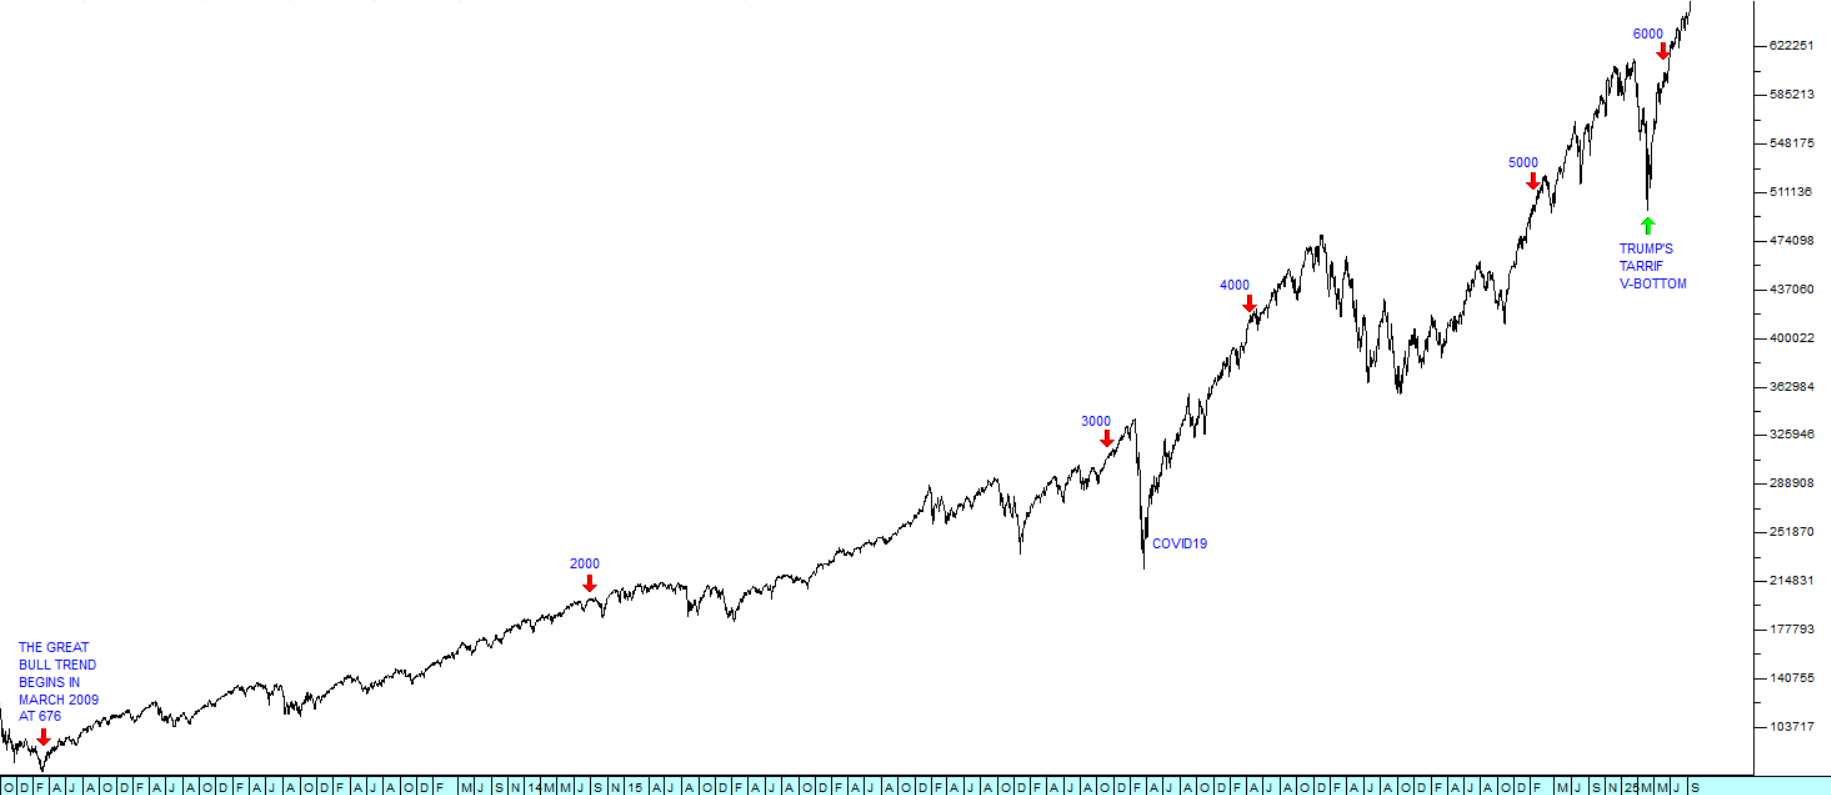
For example, look at the following 37-year chart of the JSE Overall index going back to April 1985:

JSE Overall Index: April 1985 - April 2022. Chart by ShareFriend Pro.


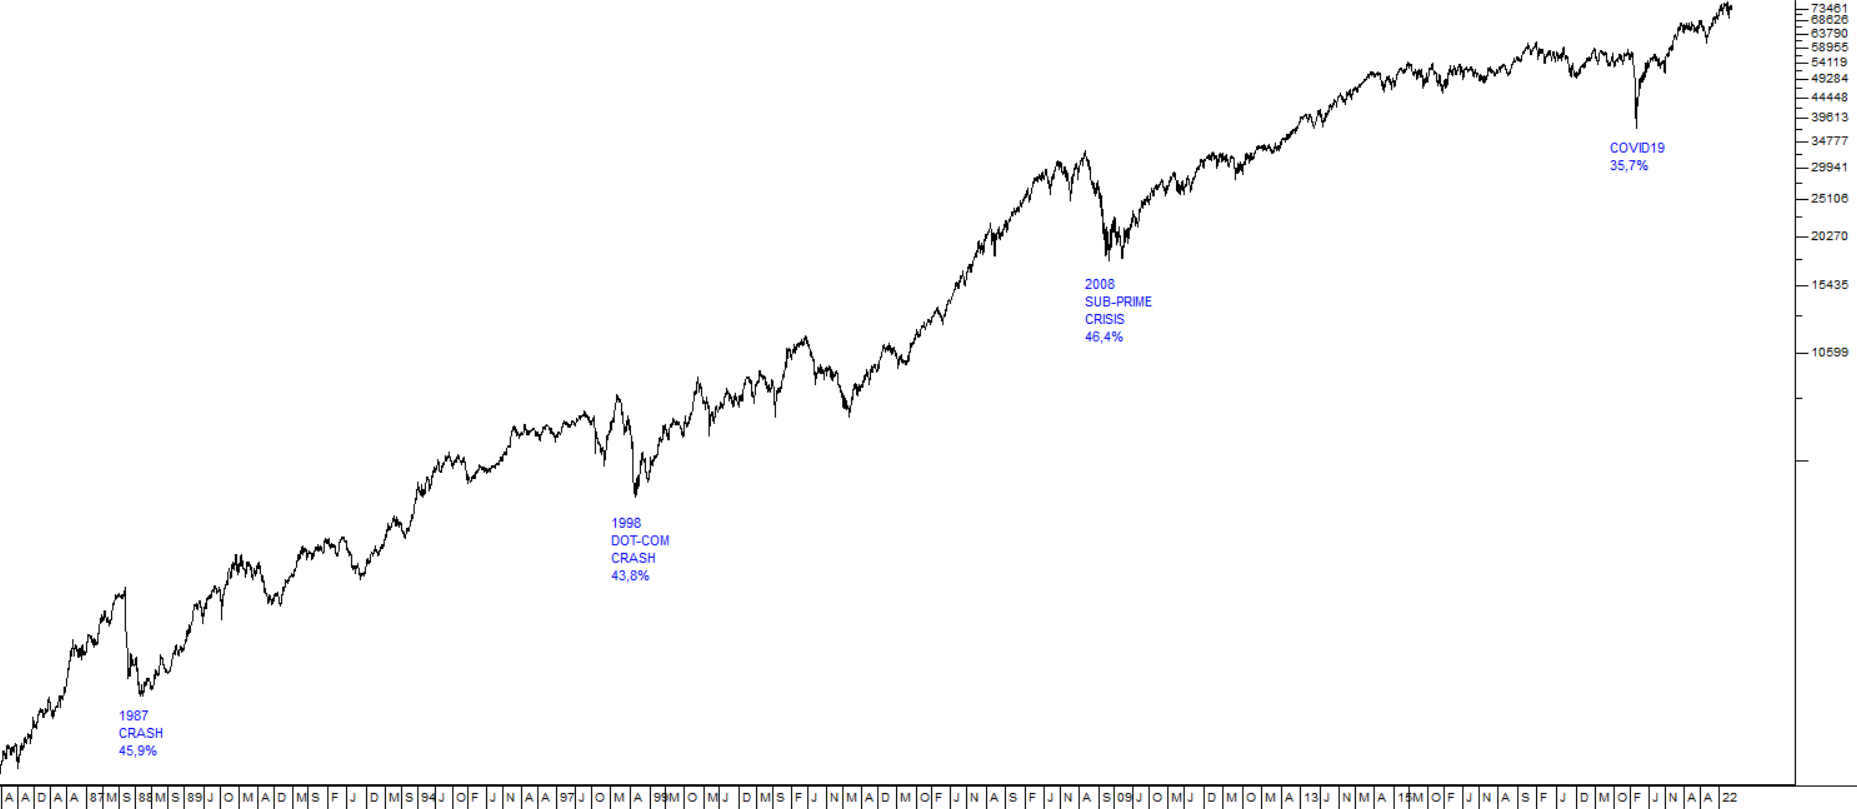
This chart is a semi-log chart. You can tell that because the index levels on the Y-axis (on the right-hand side) of the chart are compressed. On a linear chart they are evenly spaced.

You will see that we have identified four major downward trends in that index during the 37 years – the 1987 crash, the 1998 dot-com crash, the 2008 sub-prime crisis and the COVID-19 downward spike. The first three of these are very comparable, with the downward trend lasting between 4 and 6 months and taking the index down roughly 45% in each case. The COVID-19 downward trend was different, because it was not caused by normal economic events, but by the pandemic, which was an entirely unpredictable black swan event. It only took the index down 35,7% and it lasted for just 2 months. For these reasons we regard the COVID-19 spike as a technical “aberration”.

Now let us look at exactly the same chart over the same time period, but this time with a linear scale:

JSE Overall Index: April 1985 - April 2022. Chart by ShareFriend Pro.


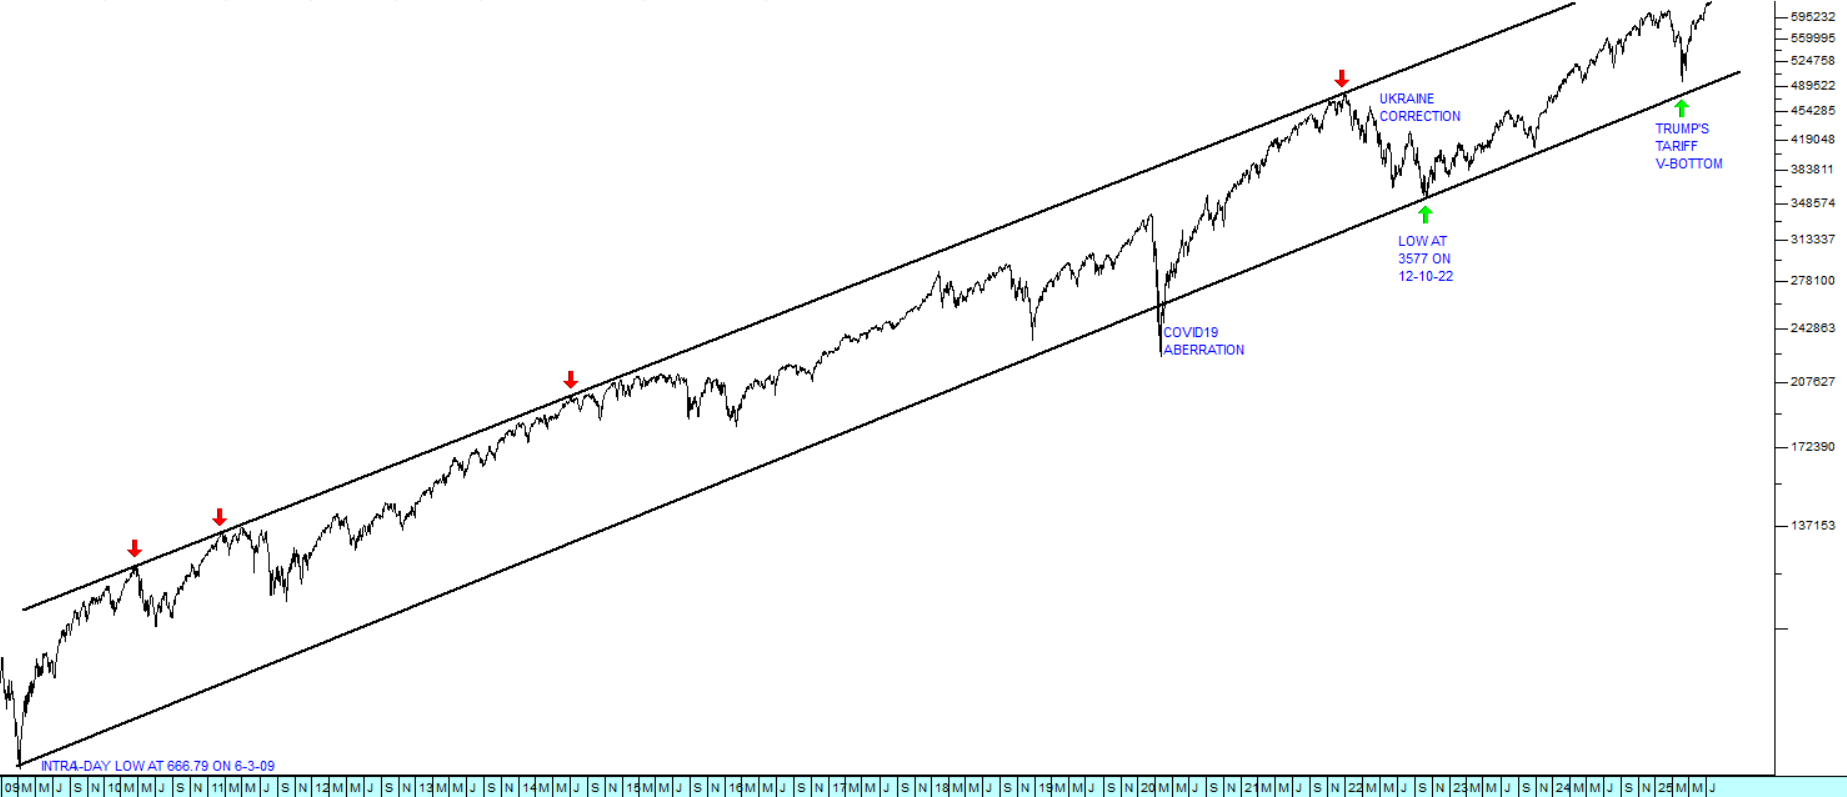
You can immediately see that the linear chart distorts the size of the various downward trends. The 1987 crash is now barely visible on the right-hand side of the chart and the 1998 dot-com crash is also significantly reduced in size, while the COVID-19 downtrend looks like the largest of these four events, even though it was in fact the smallest.

The point about a semi-log chart is that the distances on the chart represent the percentage moves rather than the moves in absolute index points. Thus, in the 1987 crash the index fell by 1517 points – but that was a 45,9% fall from its high of 2804. In the COVID-19 downtrend the index fell by 37963 index points, but that was only 35,7% of the high of 59002.

So, to sum up, it is very important when looking at charts of five years or longer that you use a semi-log scale and not a linear scale.


DISCLAIMER

All information and data contained within the PDSnet Articles is for informational purposes only. PDSnet makes no representations as to the accuracy, completeness, suitability, or validity, of any information, and shall not be liable for any errors, omissions, or any losses, injuries, or damages arising from its display or use. Information in the PDSnet Articles are based on the author’s opinion and experience and should not be considered professional financial investment advice. The ideas and strategies should never be used without first assessing your own personal and financial situation, or without consulting a financial professional. Thoughts and opinions will also change from time to time as more information is accumulated. PDSnet reserves the right to delete any comment or opinion for any reason.


Share this article:

PDSNET ARTICLES

Exponential Growth

The  S&P 500 index is important because all the stock markets around the world tend to follow it. If the S&P is in a bull trend then London, Tokyo and the JSE will also be in a bull trend – and vice versa.

The S&P500 index began 68 years ago on 4 th March 1957 with an initial value of 43,73. It took nearly

The US Jobs Market

International investors who trade on Wall Street are generally negative about any good news from the economy because it tends to make the monetary policy committee (MPC) more hawkish and less likely to reduce interest rates. The opposite is also true. But there comes a point where bad news is so bad that investors begin to fear that the US economy is heading

Jackson Hole

Once a year in late August central bankers and academics congregate in Jackson Hole to discuss the state of the economy and consider the way forward. Traditionally, the Chair of the Federal Reserve Bank (“the Fed”) addresses the meeting and gives direction to its thinking on monetary policy in the US. This year, the comments of Jerome Powell resulted in the

Choppies

Choppies is a supermarket chain which operates in Botswana, Namibia and Zambia. It is listed both on the Johannesburg Stock Exchange (JSE) and on the Botswana Stock Exchange (BSE). Notably, the company has resisted the temptation to re-enter the highly competitive and cut-throat retail market in South Africa, having exited that market in 2020 due to sustained losses. Despite

Gold Resistance

All investments throughout the world can be ranked on a scale from high risk to low risk. As a general rule, in the world of investment, risk and return rise together. In other words, as the risks in an investment increase, so does the return necessary to attract investors.

At the one end of the scale there are very low risk investments

Sibanye takes off

We have been writing about Neal Froneman and Sibanye for years now. Beginning in 2013, Froneman assembled the Sibanye group over a period of 7 years, buying up mining operations both in South Africa and America at bargain prices. Initially he bought precious metals producers, but more recently he has been diversifying into base metals like zinc and lithium which

The 16 Year Bull Trend

Since the Second World War, the stock markets of the world, including the JSE, have always tended to follow the New York Stock Exchange (NYSE) - and the NYSE is best measured by the S&P500 index (S&P) of its 500 largest companies.

For this reason, we believe it is important for private investors to constantly

CA Sales Revisited

Retailing in Africa is difficult with many of our leading retailers having attempted to open stores in countries to the North of us without notable success. These countries are often unstable and volatile politically. Getting adequate stock to branches has proved problematic and expensive.

It is not surprising therefore that a company has been

Bluetel

Bluetel (BLU) is a company involved in pinless top-ups, prepaid electricity, ticketing and universal vouchers. As such it is a company with substantial repeat business from existing customers. This type of business model is attractive to investors because it implies minimal working capital and strong cash flows.

Bluetel’s purchase

The Debtors' Book

A BIT OF HISTORY

Many years ago, in 1982 when I started this business (which became “PDSnet”), I ran advertisements in both the Rand Daily Mail (RDM) and in the Star – which were the two most widely read newspapers in Johannesburg at the time. At that time, we were a very small business and had no credit rating at all. Despite this the RDM immediately