Correction
Since the V-bottom of COVID-19 in March last year, the S&P500 index has risen an amazing 86,6% without any major correction. There have been 7 “mini-corrections” of varying sizes, including the current one (which is not yet over), but in each case the market has quickly bounced back and resumed its inexorable upward trend. Consider the chart:
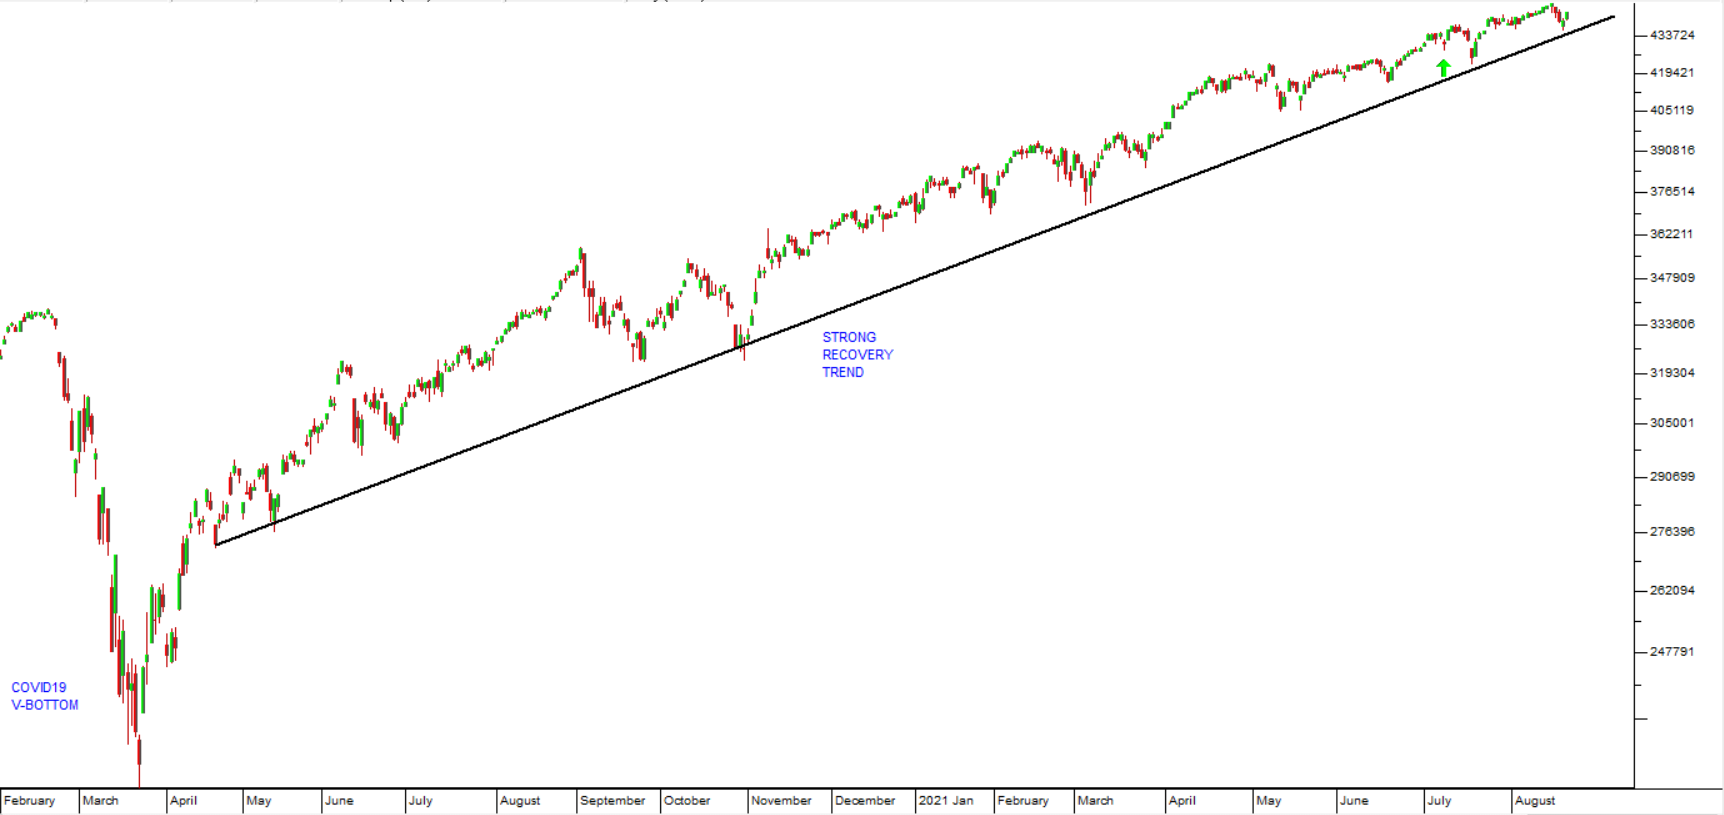
Undoubtedly, the S&P was heavily over-sold in March 2020, but the subsequent rise has, by now, more than compensated for that with a series of record highs.
On Wednesday, 5th May 2021, in our Confidential Report, we said of the S&P500 index:
“We think it will continue rising strongly, but we caution that nothing in the markets moves in a straight line – so inevitably there will be a 10% to 20% correction at some point, probably fairly soon. You should consider that, when it comes, to be a buying opportunity”
The current mini-correction was triggered by the disappointing April 2021 US non-farm payroll number, where economists on average expected one million new jobs to have been created, but, in fact, the economy only produced a “miserable” 266 000.
That brought the S&P down 4% over 3 trading days in its 7th mini-correction since COVID-19, but the underlying bullishness has quickly reasserted itself with a strong recovery on Thursday and Friday.
The upward trend over the past year is about as close as you will ever get to a straight line in the share market, and we think that the market is now ripe for a more serious correction. This correction will probably be triggered by some “bad news” from the economy – but you need to understand that markets always correct sooner or later and the news, whatever it is, is simply the way journalists and economists rationalize it.
We also said the following in the last Confidential Report:
“Rising inflation and inflation fears in America will be a key early economic indicator of any major downturn in the stock market. Inflation is currently around 2% but is now expected to tick up to around 3%”
In fact, US inflation rose to 4,2% in April 2021 – 60% higher than March’s 2,6% and the highest figure since the heady days immediately before the sub-prime crisis in September 2008.
The problem with inflation is that, like the genie, once it is out of the bottle, it can be extremely difficult to put back. And the only way to get it under control again is to stamp on the economic brakes - hard. Right now, the Federal Reserve Bank’s monetary policy committee (MPC) is not really giving inflation any serious attention – and it may only begin to respond when it is too late for anything except radical action.
Economic growth is a direct function of confidence levels and confidence in America is running high. Everyone has received their extra $1400 cheque ($2000 in California) and they are spending. The time for hoarding cash and repaying debt is over. That mood of optimism can be very difficult to curtail with conventional monetary policy like raising interest rates but the longer it is left, the more out-of-control it will become.
So, our medium-term message is clear. There is a substantial correction coming (between 10% and 20%), but we believe that when it comes it will almost certainly not be the start of a major bear trend (although it may well look like it). We still see it as a correction, scary though it will be, and hence a buying opportunity.
← Back to Articles