Buying Opportunity
Investors don’t like uncertainty, but investment is about predicting the future and, of course, that is all about assessing the impact of an array of uncertainties. As an investor you have to use your analysis, experience and understanding to reduce the level of uncertainty to an acceptable place.
Uncertainty is reflected in volatility. The more volatile a price or index is, the greater the investment risk. In fact, you could say that:
Uncertainty = Volatility = Risk
A straight line chart is the least volatile and hence carries the lowest risk. But nothing in the markets moves in a straight line. The point of equilibrium is constantly being buffeted by a deluge of facts, perceptions and emotions that wash over the market. The current price at any moment in time represents the algebraic sum of all investors’ fears and greed.
But running through all the uncertainty there is a thread of consistency which enables us to make timeous predictions with a fair degree of accuracy. That thread is human nature. Investors as a group have certain consistent behavioural characteristics which repeatedly display themselves in the charts and which can be used to improve the accuracy of our predictions.
One such characteristic is that investors as a group typically over-react. This causes the markets to exaggerate the impact of any new fundamental fact both on the upside and the downside. If you like, investors are constantly oscillating from being overly optimistic to being overly pessimistic and back again.
For example, there can be little doubt that investors became excessively pessimistic about the impact of COVID-19 when it first began to impact markets in February and March of 2020. However, they were quick to recognize and correct their mistake – which led to the sharp and uncharacteristic V-bottom in the S&P500. Consider the chart:
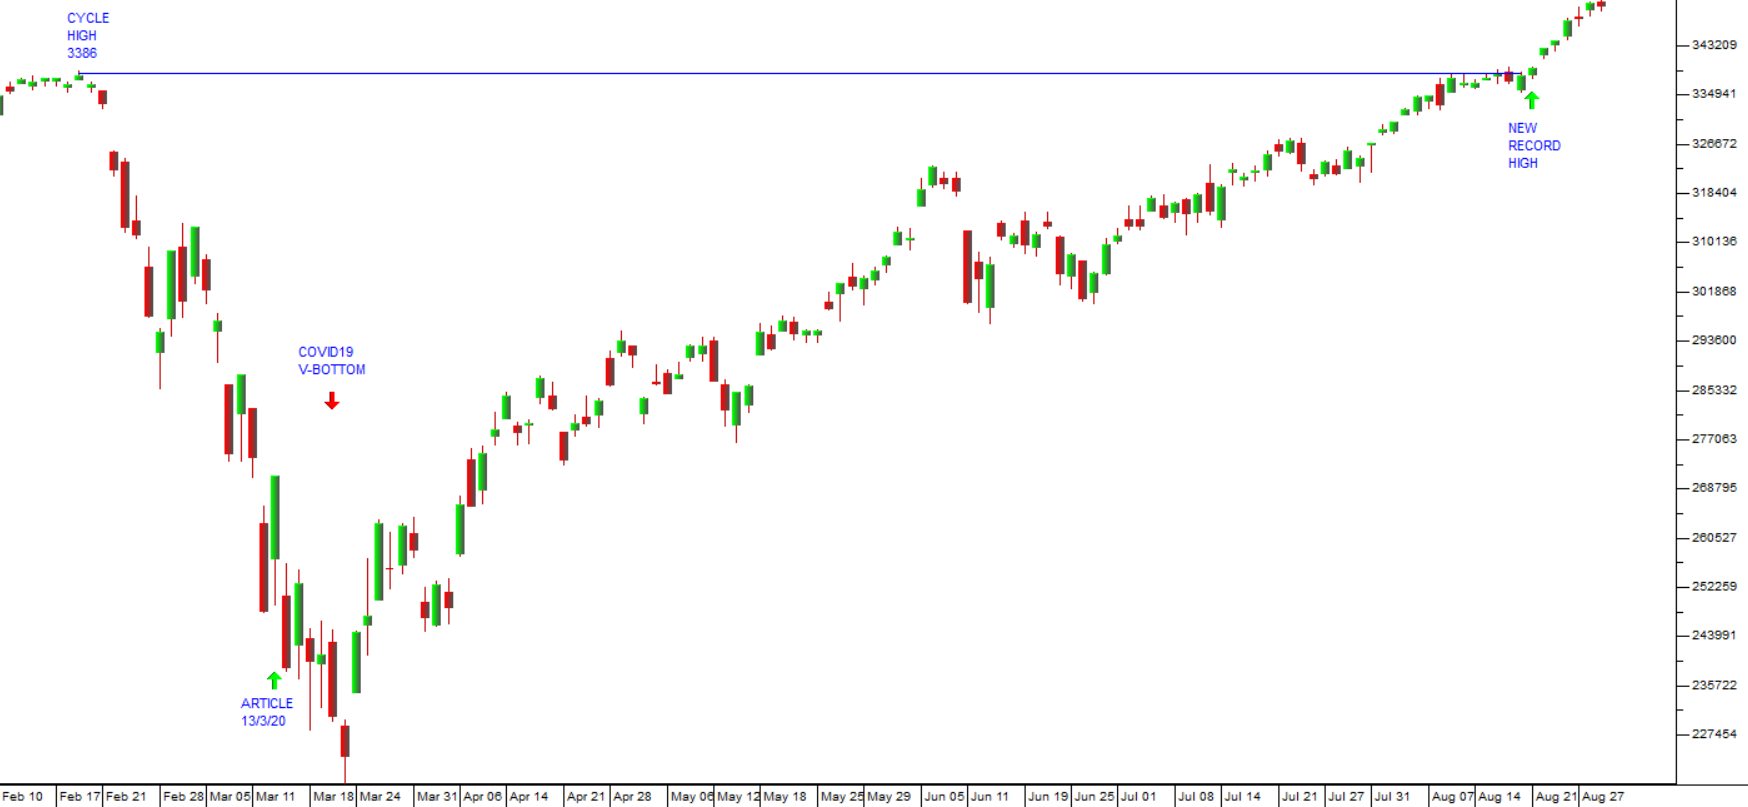
On 13th March 2020, as the market was still falling, we published an article in which I said:
“...my expectation is that we will see a “V-bottom” in the chart with a relatively short period of “backing and filling” before a new upward trend commences. And I expect that upward trend to be much more rapid than the usual recovery phase”.
That was followed by a very rapid recovery which resulted in a new record high on the S&P just five months later on 21st August 2020. The V-bottom was over. Investors had moved from excessive pessimism to excessive optimism. Over the next 16 months, encouraged by massively accommodative monetary policies worldwide, they drove the markets to an unrelenting series of new record highs.
As 2021 drew to a close, it became increasingly apparent that the optimism was being overdone. Some sort of major correction was inevitable and overdue, if only because the monetary authorities were being forced to accept that persistent inflation was becoming a problem. Sooner or later, interest rates would have to go up.
That correction began on 3rd January 2022 and is still in progress, but you should note that on that date (3/1/22), nobody was seriously predicting that Vladimir Putin would invade Ukraine just one month later. And, without Mr. Putin’s invasion, there is little doubt that the correction would have reached its lowest point on 27th January 2022 when it had fallen barely 10%.
A few days after that date, when the S&P had risen strongly off the 4300 support, we were able to predict with a fair degree of certainty that markets would fall further, and that the bullishness was misplaced. On 7th February 2022 in an article, we said:
“Our expectation is that the upward move on the four days from Friday 28th January to Tuesday 2nd February represents a “bull trap” - which means that the correction will fall further”.
That prediction was based entirely on our view that the correction had not gone far enough. At the time we were completely unaware of Mr. Putin’s planned intervention in Ukraine, but we knew that something would come up which would take markets down further. Consider the chart:
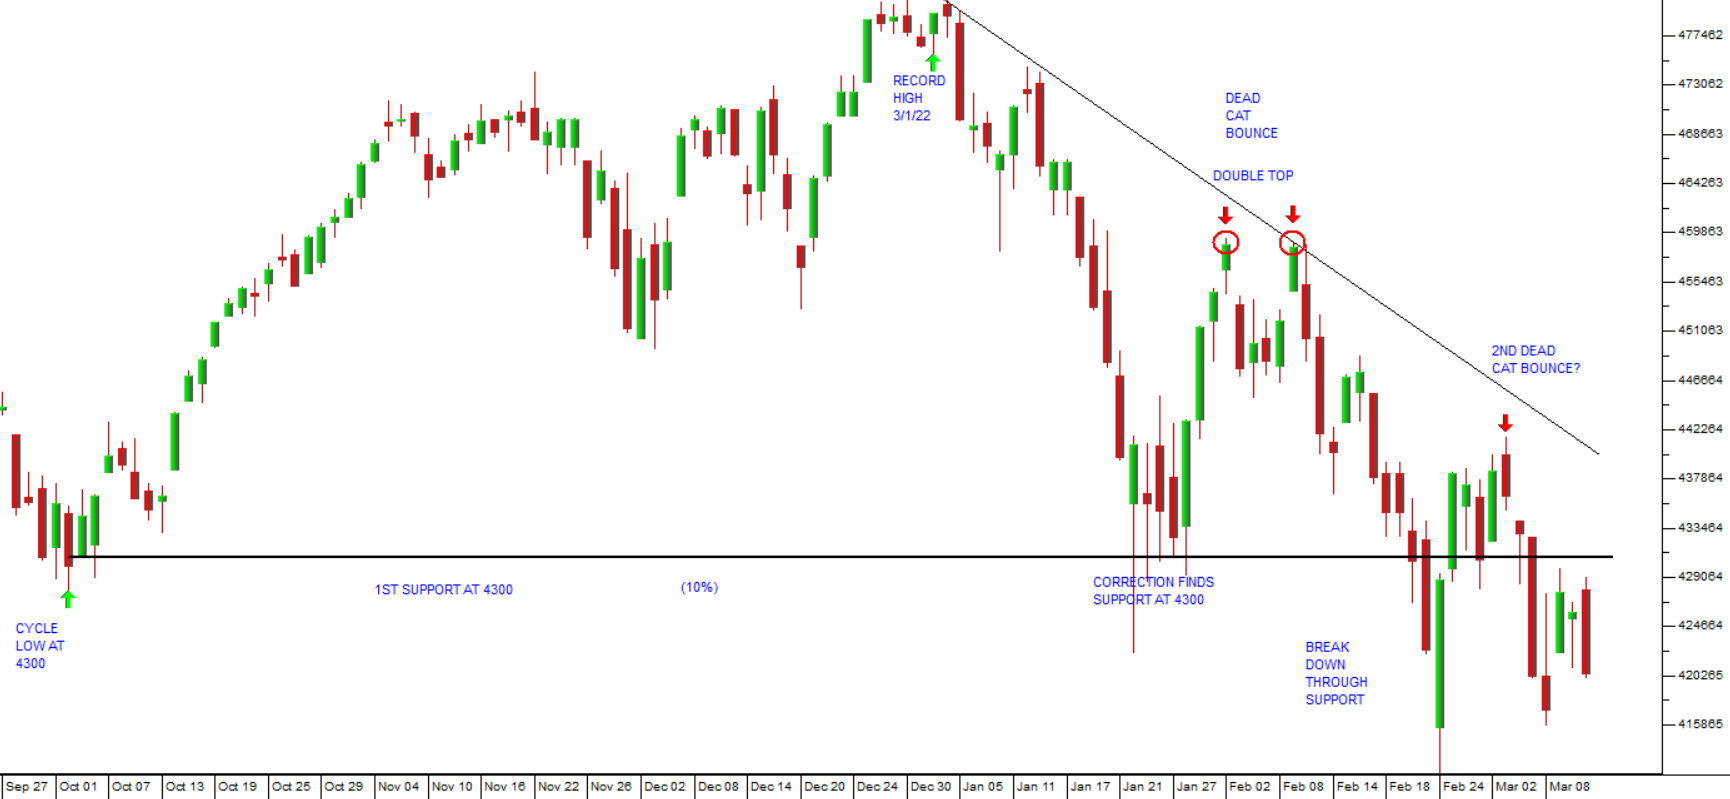
We have pointed out that this correction has been characterized by “excessive optimism” which has resulted in two “dead cat bounces”. But despite this, the support level at 4300 has now been convincingly broken. We now expect a period of uncertainty, characterized by a sideways market with the S&P oscillating between 4000 and 4300 as Zelensky and Putin are forced to arrive at some sort of compromise.
But the Ukraine issue is just a temporary side show for the market. The real underlying problem is that inflation rates worldwide are rising and will demand a central bank response. That response will eventually impact negatively on markets probably towards the end of 2023 or in 2024.
In the meantime, the bull trend will continue – so what we are looking at now is a buying opportunity.
← Back to Articles