Market View
J200 109,593.00 +2.18% J203 117,518.00 +1.92% J210 124,691.00 +5.67% J211 132,176.00 +1.13% J212 26,911.00 -0.17% J213 146,750.00 +0.49%
Winning Shares (Top 5)
Code Name Added Price Latest % Gain % Gain/Year
CPI CAPITEC 2023-11-04 185496 482921 +160.34% +58.12%
KST PSG-FIN 2024-05-23 1610 3383 +110.12% +49.87%
SSU SSU 2024-05-17 555 1010 +81.98% +36.85%
AEL ALTRON-A 2026-04-15 2199 2749 +25.01% +80.08%
OCT OCTODEC 2025-08-21 1100 1749 +59.00% +61.35%
Opinions (Top 5)
Code Name Date Action
EPS EASTPLATS 2026-08-10 View

East Plats (EPS) is a mining exploration and development company engaged in the platinum group metals (PGM) and chrome markets in South Africa. The company is listed on the Toronto Stock Exchange (TSX) and the JSE. The company has three projects - the Crocodile mine, which ceased operating in 2012 and is under care and maintenance, Sound Mine Solutions engaged to produce an independent technical report on the Zandfontein tailings retreatment and storage facility to recover chrome, and the Zandfontein project, which is a tailing retreatment project conducted with Union Goal.

On 11th February 2019, the company announced that it had made its first shipment of 10 000 tons of chrome concentrate from the Zandfontein operation. The company still foresees considerable cash flow uncertainties over the next 12 months which brings its "going concern" status into question.

In its results for the year to 31st December 2025 the company reported revenue up 31,2% and a loss of 9c (US) compared with a loss of 6c in the previous period. The auditors expressed a material concern over the company's ability to continue as a going concern. The company said, "Net loss attributable to equity shareholders was $18.4 million ($0.09 loss per share) in FY2025 compared to net loss attributable to equity shareholders of $12.8 million ($0.06 loss per share) in FY2024".

In an update on the 1st quarter of 2026 the company reported revenue down 6,8% and an attributable loss of $4,1m compared with a loss of $6,9m in the comparable period. The company said, "We had a challenging first quarter as monthly run-of-mine processing tonnages at the Crocodile River Mine were lower than targeted".

The share is very thinly traded with very few shares trading on average, each day - which makes it impractical for private investors. The company announced that Changyu Liu would be appointed as interim CEO with effect from 13th August 2026.

SUR SPURCORP 2026-08-10 View

Spur (SUR) is a very well-known franchisor with 701 fast-food restaurants. In South Africa it has 559 restaurants (with 80% able to trade during load-shedding) and it has branches overseas. About two-thirds of its sales in South Africa come from Spur Steak Ranches, and the balance comes from a variety of franchise brands which the company has acquired over the years.

Among these are John Dory, Panarottis and, more recently, RocoMamas and Hussar Grill. It would appear that South Africans (at least those who can afford restaurant food) were somewhat bored with the well-known brands such as Spur, but attracted to the recently acquired brands of smash burger specialist, RocoMamas and steakhouse Hussar Grill.

This share is very much determined by consumer spending, which has been under pressure. The company is experimenting with meal kits that can be delivered and eaten at home. What is notable about this company is that the out-going CEO, Pierre van Tonder, has left it with no debt - the main reason it has not needed to undertake a rights issue.

In its results for the six months to 31st December 2025 the company reported revenue up 8,5% and headline earnings per share (HEPS) up 13,6%. The company said, "The group achieved a solid trading performance with franchised restaurant sales increasing by 8.0% over the prior comparable period.

In South Africa, 29 restaurants were opened during the period and 26 restaurants were revamped. Eight restaurants were closed". In a trading statement for the year to 30th June 2026 the company estimated that adjusted HEPS would be between 5% and 13% higher. The share looks reasonably valued and has broken strongly up through its long-term downward trendline following the latest results.

In the end, following the COVID-19 crisis in March 2020, the share reached a low of 1240c on 7th September 2020 but has now recovered to 4100c. It was added to our Winning Shares List (WSL) on 8th August 2023 at 2488c so it is up about 65% in 33 months - not a spectacular performance, but solid.

TGA THUNGELA 2026-08-10 View

Thungela (TGA) is Anglo American's coal assets which has been unbundled into the hands of Anglo shareholders and separately listed on the JSE and the LSE because of Anglo's policy of moving away from carbon-based fossil fuels like coal. Anglo sold its last 8% of Thungela on 25th March 2022 for R1,67bn.

Thungela is a major thermal coal exporter in South Africa. It has over 7500 employees and exports coal to Asia, India, SEA, and East and North African countries. The company owns 50% of Phola, which operates a coal processing plant, and it has a 23,22% interest in the Richards Bay Coal Terminal (RBCT).

The company has the capacity to produce over 90m tons of coal per annum. The company operates 7 mines in South Africa, 4 open cast and 3 underground. The share began trading on the JSE on 7th June 2021 and immediately fell to 2190c from 2600c. It was originally estimated to be worth a minimum of 4400c but reached a high of 37752c on 16th September 2022.

Since then it has been moving sideways and downwards with lower coal prices and problems with Transnet. Obviously, it is also subject to the volatility of being a single commodity share and dependent on Transnet to get its product to port. The company has committed to paying out at least 30% of "...adjusted operating free cash flow." in the form of a dividend.

In its results for the year to 31st December 2025 the company reported revenue down 17% and a headline loss of 647c per share compared with a profit of 2559c in the previous year. The company said, "Adjusted operating free cash flow* of R396 million for the year and net cash* of R5.1 billion at 31 December 2025.

Declaration of a final ordinary cash dividend of R2 per share, taking full year dividend to R4 per share". In a trading statement for the six months to 30th June 2026 the company estimated that HEPS would increase by between 140% and 158%. Thungela was drifting sideways and downwards until December 2025, but it has begun a strong new upward trend.

On 21st January 2025 the company announced that its CEO, July Ndlovu, will retire in July 2025 and be replaced by Moses Madondo on 1st August 2025. Obviously, the war in Iran has had a negative impact. It remains a volatile commodity share. 

MNK MONTAUK 2026-08-07 View

Montauk (MKR) is an American company that specialises in extracting methane from landfills, mostly in America. The company benefits from the fact that America requires refiners of fuel to include a percentage of renewable fuels in their product. This gives Montauk a lucrative guaranteed market for its product.

In fact, they do not have sufficient landfills in America and they are now experimenting with cow manure as a new source. In its results for the six months to 30th June 2026 the company reported revenue up 14,5% and headline earnings per share (HEPS) of 1c (US) compared with a loss of 3c in the previous period.

The company's net asset value (NAV) rose by 3,9% to 185c per share.  In our opinion this share remains fully priced at current levels on a P:E of 52,2 (6-8-26). Another problem is that the company is very dependent on the regulatory environment in America. If the government decides to change the rules, its profitability could evaporate.

Aside from those risks, it is a rand-hedge share which is involved in exploiting renewable energy in the United States - which possibly makes it interesting.

QLT QUILTER 2026-08-07 View

Quilter Plc (QLT) is a company spun out of Old Mutual as part of that group's "managed separation" process. It was admitted to trading on the London Stock Exchange (LSE) and has had a secondary listing on the JSE from 25th June 2018 following the issue of a prospectus on 20th April 2018.

Quilter is a UK financial services group which offers asset management in the UK and internationally. It has 900 000 customers and had GBP101,7bn assets under management (AUM) at 30th June 2023. It is also involved in life assurance. The company has a good track record as a multi-manager for client wealth.

More than 60% of Quilter's shareholders are South African institutions. As this company is wholly based overseas it is a rand-hedge. Any strengthening of the rand against the British pound will see this share fall and vice versa. In its results for the six months to 30th June 2026 the company reported AUM up 11% to GBP157,4bn and with inflows of GBP5,8bn.

The company said, "Revenues grew by 12% to £379 million (H1 2025: £337 million), reflecting strong growth in management fee revenue partially offset by lower investment revenue generated on shareholder funds". Technically, the share has broken up out of an "island" formation and is in a strong upward trend.

We regard this company as solid rand hedge and an institutional favourite. It was added to the Winning Shares List (WSL) on 23rd November 2023 at 2154c and has risen to 4322c (6-8-26). As the UK economy recovers it should do well. 

Winning Share: AEL
Opinion: EPS
The Sideways Market  (2026-07-27)

Since its inception in 1960 the JSE Overall index, including dividends, has generated an average compound growth rate of approximately 14,5% per annum in nominal terms. Of course, during that time there have been moments when the index was heavily over-priced – like in October 1987, immediately…

Since its inception in 1960 the JSE Overall index, including dividends, has generated an average compound growth rate of approximately 14,5% per annum in nominal terms. Of course, during that time there have been moments when the index was heavily over-priced – like in October 1987, immediately before the 1987 crash – and moments when it was heavily under-priced like March 1988 immediately after that crash.

Stock market averages or indexes, like the JSE Overall index, over time, always tend to equate to the real growth in the economy - plus the inflation rate. Sometimes investors get overly excited and bid shares up well above their real values and sometimes they become depressed and maudlin, causing shares to fall to record lows. But overall, in the long term, the JSE (and all stock markets around the world) will always go up because of the real growth in their economies and the steady erosion of the purchasing power of paper currencies that we call inflation.

The progress of share market indexes over time could be represented diagrammatically as follows:

Diagram : Market Cycle

The rising straight line represents the real growth of the economy plus the inflation rate, and the curved line shows the theoretical progress of the index through a full cycle. As you can see it fluctuates from being under-priced to being over-priced and back again.

At its lowest point (“A”), after a long downward trend, investor sentiment is balanced between the bulls and the bears (50/50). The negativity of the bears is now being balanced by the realisation that shares are very cheap, and bargain hunters are busy snapping up any loosely held scrip.

As the index begins to move up, sentiment shifts. More and more investors become bullish and there are fewer and fewer bears. Eventually, the index crosses that magical “real value” line (“B”) and the shares become over-priced – but it continues to go up. At this time, about 80% of investors are bullish and only 20% are bearish.  

Eventually, some investors, (the smart money) begin to realise that shares are now over-priced, and they start off-loading their holdings. The point is reached where the bulls and bears are again in balance (“C”) with roughly half of them bullish and the other half bearish (50/50).  

So, what is a sideways market? It is a period when investors as a group are more-or-less evenly divided between the bulls and the bears (i.e. 50/50). For a while neither can gain ascendancy and the index moves sideways. This typically happens at the top and the bottom of the cycle, but it can also happen during the upswing or downswing.

The S&P500 index, for example, right now has been moving sideways since about the end of May 2026 - a period of nearly two months. The shares of the Magnificent Seven have been moving sideways or downwards, but during that time the companies which make up the index have continued to grow and make profits – it is just that investors are worried about where they might go next.

The bears are out in force and there is the added uncertainty of where interest rates might go when the Monetary Policy Committee (MPC) meets again at the end of July. Tesla and Alphabet’s quarterly results were less than wonderful. Investors are suddenly worried about Alphabet’s expected $200bn full-year capex and Tesla’s disappointing profit. And now they are worried about Microsoft, Amazon and Meta which report next.  

Actually, if you consider that Trump has resumed the Iran war and that the Houthis have closed the critical Strait of Bab-el-Mandeb pushing the price of North Sea Brent up to as high as $100, the S&P is doing relatively well. American analysts are calling the market “frothy” or talking about investors “walking on eggshells”.

This does not mean that the upward trend is over or that we are now looking at an impending bear market. It just means that the S&P is pausing to catch its breath after the rapid rise during April and May 2026. Markets never move in a straight line – there are always rallies and corrections and periods of indecision.

In our view, Trump is now facing a terrible dilemma. The November mid-term elections are just 3 months away and his approval rating is disastrous. His traditional MAGA supporters are abandoning him in droves because they really don’t like the high price of fuel. And his bombastic attitude towards the war, which everyone knows he started, is just making the situation far worse. We believe his time is rapidly running out. But we also believe that the AI productivity boom is just beginning and that markets will continue to rise to new record highs. Our view is that the longer this sideways market persists, the stronger will be the upward move when it is finally resolved.    


The Hyprop Investment  (2026-07-20)

Property shares do not generally make very exciting investments – but they make up for that by being very secure. Their security lies in the fact that their net asset value (NAV) is mostly comprised of very conservatively valued properties. Other companies often have insubstantial assets in their…

Property shares do not generally make very exciting investments – but they make up for that by being very secure. Their security lies in the fact that their net asset value (NAV) is mostly comprised of very conservatively valued properties. Other companies often have insubstantial assets in their NAV like goodwill, intellectual property and other intangibles.

The property market is recovering from the impact of COVID-19 which saw many good quality property companies trading at a fraction of their NAV. The big institutional investors who make up 90% of the JSE really like secure investments. They were shaken out of property shares by COVID-19, but they are gradually regaining their appetite for them. 

One of the best examples of an institutional share that lost favour in 2020 is Hyprop which reached a low point of 1467c on 24th April 2020 – less than 20% of its NAV at the time. By anyone’s measure at that price it was a raging bargain.

Back then we were not yet producing the Winning Shares List (WSL) but we wrote an article about Hyprop which we published on 23rd November 2020 after the share completed a double bottom or island formation and it began to appreciate. Consider the chart:

Hyprop Investments Ltd (HYP) : March 2016 - 17th of July 2026. Chart by ShareFriend Pro.

The double bottom formation is a very solid and visible indication that a long downward trend is almost certainly over. At the time we recognised that Hyprop had broken up out of its island and was beginning to appreciate.

It took another two years before the institutional investors finally recognised its value and began buying it up in earnest. It began to recover and then we added it to the WSL on 15th August 2024 at 3439c. Since then, it has been appreciating steadily.

You will note that at its peak, back in August 2016, Hyprop reached a record high of 14100c – at which time it was trading almost 50% above its NAV of the time. On Friday last week it closed at 6052c – which was just below its NAV of 6443c. So, we see it as having some considerable further upside potential given the gradual improvement in the South African economy.

When thinking about this company you cannot help being impressed by the high quality of the assets which it owns. These include Canal Walk in the Western Cape, Somerset Mall, Hyde Park Corner, Rosebank Mall, and Clearwater Mall. These assets are almost always close to fully let (3,1% vacancies on average) and patronised by high-end A/B income group shoppers. At year-end on 31st December 2025 the company had a loan-to-value of just 31% - which means that it has plenty of headroom for further acquisitions.

In a pre-close operational update for the five months to 31st May 2026 the company reported a 4,5% improvement in collections and a 5,5% improvement in tenants’ turnover. The company said, “Demand for space remains exceptionally high, with a 0% vacancy rate in May 2026.”

We have no hesitation in recommending this share for your investigation, especially if you are looking for a more conservative long-term investment with a low risk profile.

Altron - 2026 Results  (2026-07-13)

Altron is one of the best companies listed on the JSE and a long-time favourite of ours. We first added it to the Winning Shares List (WSL) back in November 2023 when the share was just 949c. Just over 2 years later in January 2025 it reached a high point of 2439c (10-1-25). After that it moved…

Altron is one of the best companies listed on the JSE and a long-time favourite of ours. We first added it to the Winning Shares List (WSL) back in November 2023 when the share was just 949c. Just over 2 years later in January 2025 it reached a high point of 2439c (10-1-25). After that it moved sideways for the next sixteen months and we only again became interested in it following its trading statement published on 12th February 2026 where it predicted that the headline earnings per share (HEPS) from on-going operations would increase by at least 30%.

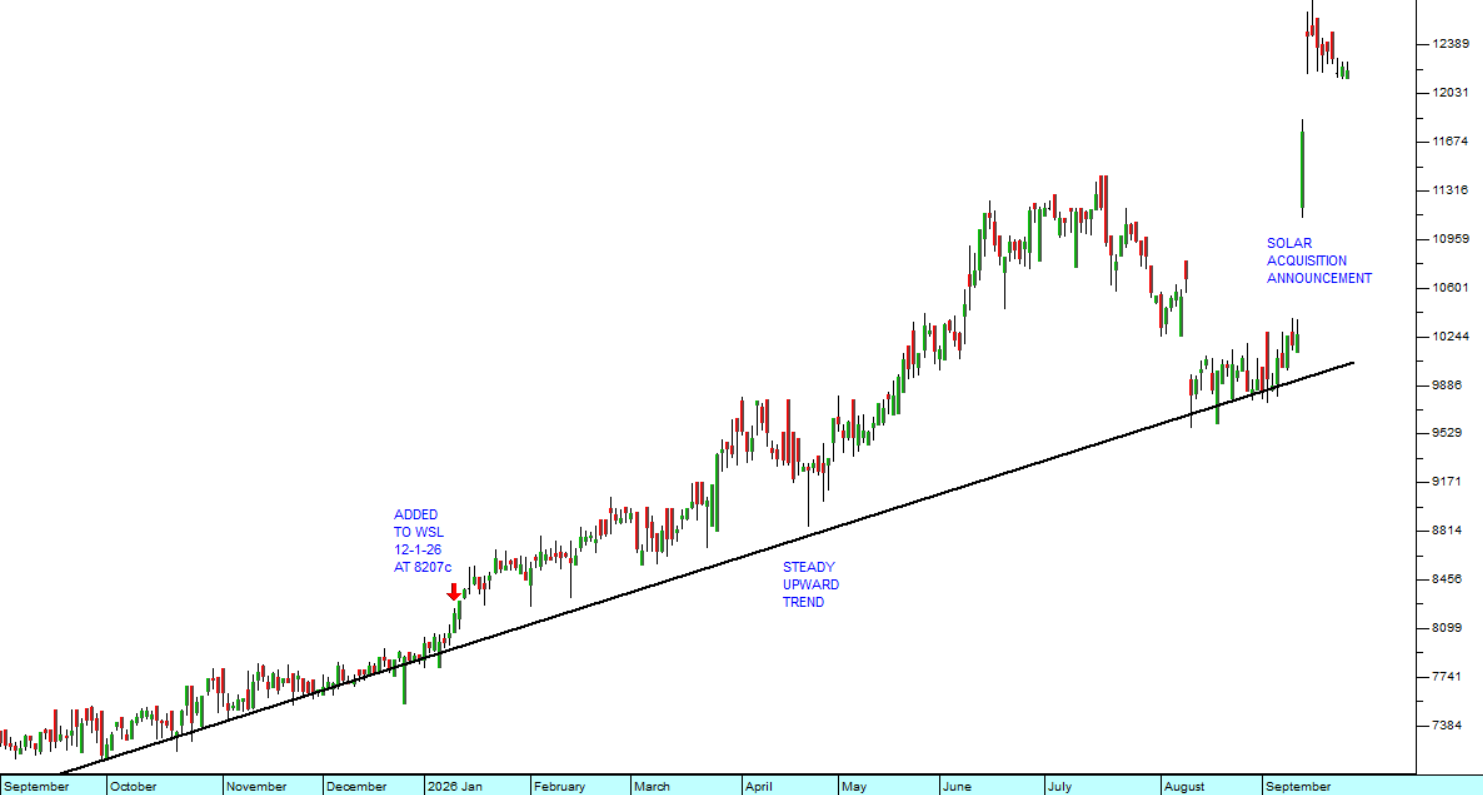
After an investigation we decided to again add it to the WSL on 15th April 2026 at a price of 2199c. That was just 3 months ago, and the share has since gone up by an impressive 30% - which equates to about 125% per annum. Consider the chart:

Altron (AEL) : July 2023 - 10th of July 2026. Chart by ShareFriend Pro.

This story is an object lesson in paying attention to the messages which listed companies regularly post on the Stock Exchange News Service (SENS) especially their trading statements. In a trading statement the board of directors give their best assessment of what the company’s HEPS will be in its next set of financial statements.

In Altron’s case their first trading statement was published more than 3 months before its financials came out on 25th May 2026. This gives the active private investor plenty of time to investigate thoroughly and even to visit the companies place of work and try to speak to one of its directors.

When the results finally came out, the share price shot up because they were truly exceptional in a number of respects. Firstly, HEPS from continuing operations rose by a solid 34% and secondly the company showed that they were completely debt-free and had more than R1bn in cash in the bank. As soon as the institutional fund managers saw those points and various other strong ratios in the company’s financials they immediately began buying up as many shares as they could lay their hands on. The result is that the share rose to a new record high of 3005 on 15th June 2026. Since then, it has been moving sideways.

My point is that everything that I have said in this article was in the public domain and you could easily have taken advantage of it. Hopefully, some of you did. The JSE regularly provides excellent highly profitable investment opportunities for those private investors who are willing to a little homework. Your Share Friend software gives you a complete up-to-date list of all the SENS messages published by every listed company every day. All you need to do in Share Friend is hold down the Alt key and press the letter “S”.

Follow-up

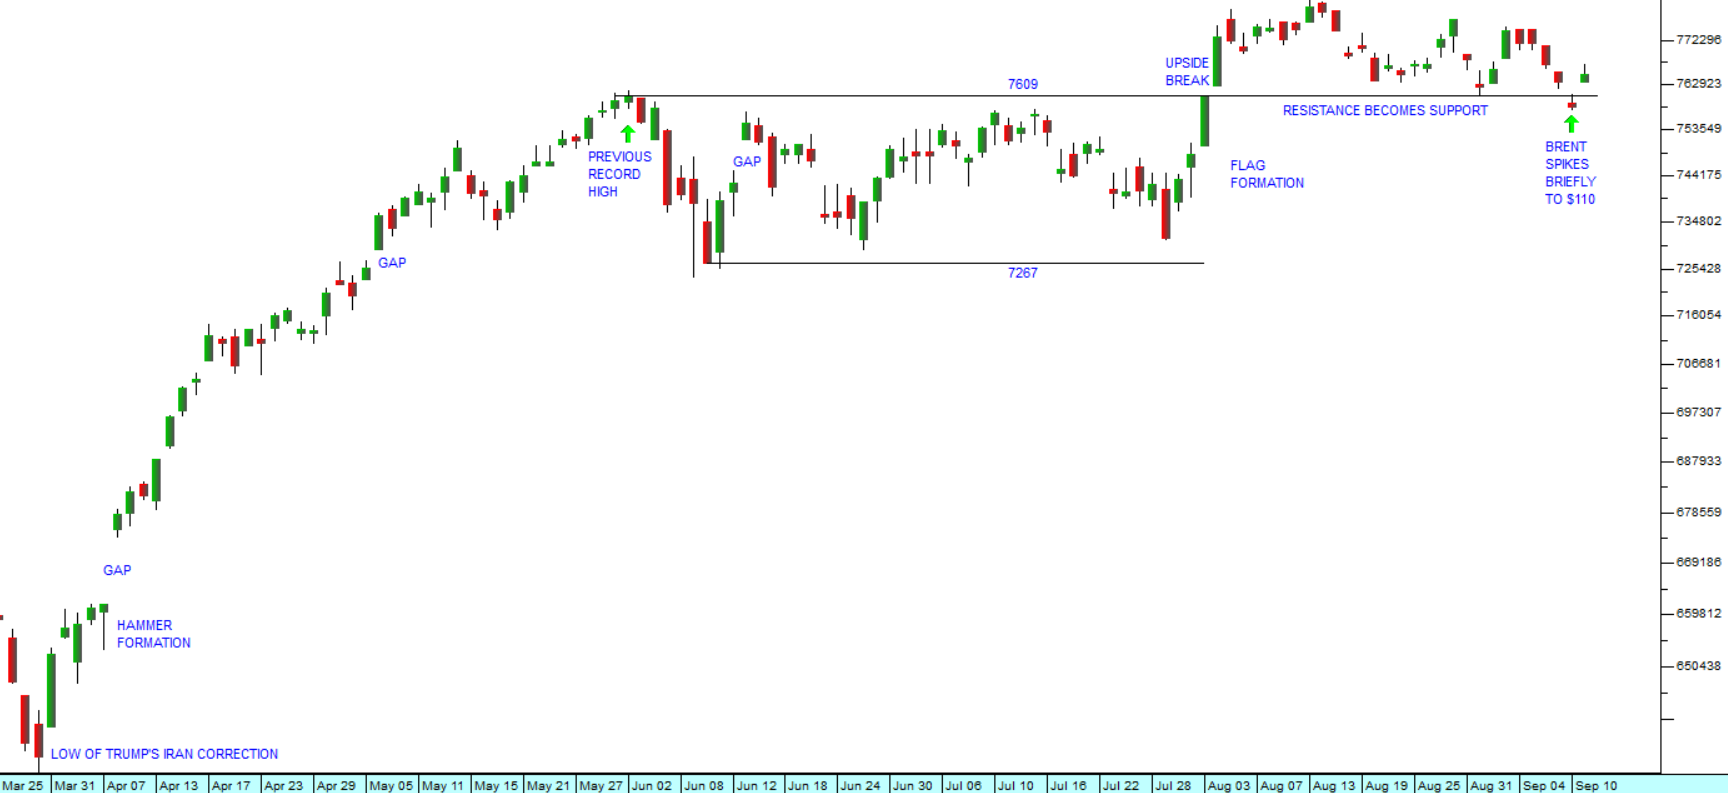
In last week’s article on candlestick charting as it is applied to the S&P500 index, I drew attention to the fact that the S&P was in a triangle formation and I suggested that it would almost certainly break out of that formation to the upside fairly soon. Well, it has now done that. Look at the chart:

S&P500 Index : 2nd June 2026 - 10th of July 2026. Chart by ShareFriend Pro.


In our view it will almost certainly now break to a new all-time record high very soon.

The most notable observation of the week was just how little the oil price went up when Trump decided to resume his bombing of Iran and the Strait of Hormuz was once again closed. Clearly the world economy and the stock market have moved on and the Strait can no longer influence the oil price or the world economy as it did in February.  

JSE Top 40

109,593.00 (+2.18%)

All Share

117,518.00 (+1.92%)

Financial 15

26,911.00 (-0.17%)

J200
J203
J212
Top Gainers
# Code Name Close (c) % move
1 EUZ EUROMET 32 +28.00%
2 GCT GRP 1800 +20.00%
3 RNG RANGOLD 345 +12.75%
Top Losers
# Code Name Close (c) % move
1 ACS ACSION 610 -45.05%
2 EPS EASTPLATS 355 -43.20%
3 OAO OANDO 20 -23.08%

Top Movers – Charts

Top Gainer: EUZ
Top Loser: ACS