Market View
J200 109,270.00 -0.01% J203 116,726.00 +0.03% J210 135,952.00 -0.43% J211 121,739.00 -0.12% J212 26,274.00 +0.69% J213 139,134.00 +0.25%
Winning Shares (Top 5)
Code Name Added Price Latest % Gain % Gain/Year
VAL VALTERRA 2025-07-03 83183 137983 +65.88% +56.18%
ISA ISA 2024-02-09 140 225 +60.71% +23.63%
PPE PURPLE 2025-04-16 120 189 +57.50% +41.48%
QLT QUILTER 2023-11-21 2154 4013 +86.30% +30.94%
SSS STOR-AGE 2024-08-30 1449 1594 +10.01% +4.97%
Opinions (Top 5)
Code Name Date Action
BEL BELL 2026-09-07 View

07-09-2026   Bell (BEL) is a manufacturer and distributor of heavy equipment, earth-moving equipment to the mining construction, agriculture, and waste management industries. As such, it has been directly impacted by the slow-down in construction since 2008 and collapse of the mining industry.

Bell's articulated dump trucks are exported world-wide from South Africa and Germany. Bell also has dealerships for a number of other global manufacturers, giving it a product range of over 120 products. Roughly 60% of its business comes from outside South Africa. The company employs 3200 people of whom 88,6% are in South Africa.

The CEO of Bell, Gary Bell has indicated to Business Day that the company would consider delisting with 1A Bell making an offer to minorities (but he did not disclose at what price). Some of those minority shareholders are now saying that the board has a fiduciary duty to put the company up for sale to the highest bidder.

In its results for the six months to 30th June 2026 the company reported revenue down 12% and headline earnings per share (HEPS) down 74%. The company said, "While certain mining commodities have fared better than others, the traditional sectors in which our products are operated have been under pressure.

The pervasive impact of fluctuating oil prices at higher levels has added further pressure at a time when this can be least afforded". We no longer see this as a great investment for private investors. On 4th March 2026 Bell announced that they had concluded a "collaboration" with CNH Industrial to supply construction equipment branded motor graders.

On 11th June 2026 the company announced that the CEO, Ashley Bell, has resigned with effect from 31st August 2026. He will be replaced by Izak van Niekerk.    

ARI ARM 2026-09-07 View

04-09-2026 African Rainbow Minerals (ARI) is a diversified mining company controlled by Patrice Motsepe, involved in a variety of mining ventures. Its interests include platinum group metals (PGM), iron ore, manganese, chrome, coal and copper. It also owns 12,2% of Harmony Gold. There has been some speculation about a possible acquisition.

One possibility is an involvement in the Wafi-Golpu copper and gold resource which is jointly owned by Harmony and Australian mining company, NewcreSt. Harmony is looking for help in financing its share of the development cost of this massive resource - which is estimated at around R21bn - so maybe ARM could be part of that solution. The company is looking for acquisitions of "green metals" mines that produce metals used in the move to avert climate change.

In its results for the year to 30th June 2026 the company reported revenue up 25% and headline earnings per share (HEPS) up 19%. The company said, "The increase in headline earnings was primarily driven by higher US dollar PGM basket prices, partially offset by lower average realised rand iron ore prices and lower local sales volumes at Beeshoek Mine". Technically, the share has been going up since April 2025.

We think that this is a good mining share which is gaining stability from its diversification into base metals. On 12th June 2025 the company announced a "collar" options agreement consisting of a put option on 18m Harmony shares at 23485c per share and a call option for the same number of shares at 56240c.

The purpose of the agreement was to increase the company's available liquidity, taking advantage of the rising US dollar price of gold. In recent months the share has again been rising on higher commodity prices. It remains volatile and hence risky.

DSY DISCOVERY 2026-09-04 View

03-09-2026   Discovery (DSY), developed and built by Adrian Gore over the past 25 years, offers the A/B income group of people a matrix of financial services which are inter-linked and cross-selling. Thus a customer can begin with his/her medical aid and then add to that a variety of insurance products and now, most recently, personal banking products.

Discovery's "Vitality" concept, which rewards clients for looking after their health in various ways, is extended to their driving record and a rewards system that ensures that there are attractive benefits for taking the full range of Discovery debit-order products. The Vitality platform tracks over 1000 customer activities and 50 biometrics a minute by using the Apple watch in South Africa, the UK, China, Europe and the US to ensure a process of healthy aging and retirement planning.

Discovery's Chinese company, Ping An Health, in which Discovery has a 25% stake, saw membership grow by 60% over the year, and written premiums increased by 87% to $753m. Ping An is rapidly developing into Discovery's "Tencent". Discovery shares remain expensive, but we regard this as one of the best shares for a private investor to hold for long-term growth.

CEO, Adrian Gore, says "I am a great believer that opportunities are not in good times." - indicating his belief that growth comes from investing during the difficult times such as South Africa is currently experiencing. Gore has also stated that the NHI, as it is proposed, is unaffordable for South Africa and that there are insufficient medical resources to implement it.  In its results for the year to 30th June 2026 the company reported annualised premium income up 6% and income from non-insurance business up 10%.

Headline earnings per share (HEPS) increased by 33% and profit from operations by 17%. The company said, "Discovery South Africa delivered 16% growth in normalised profit from operations, reflecting strong contributions across all businesses. Vitality increased normalised profit from operations by 21%".

Technically, the share has been in a strong upward trend since June 2024. We added it to the Winning Shares List (WSL) on 1st August 2024 at 14280c. It has subsequently moved up to 25970c (3-9-26). Due to the quality of its management and business model, we see this as a "must have" share for any private investor's portfolio.

SNT SANTAM 2026-09-04 View

03-09-2026   Santam (SNT) is South Africa's largest short-term insurer with about 22% of the market. This means that it does not engage in endowment insurance, annuities or any kind of investment insurance. It insures assets, like buildings and vehicles and individuals against risks which they cannot afford such as the loss of their income through disability or death.

Santam pays the first R150m of any claim and then relies on its re-insurance policy. The company has level 1 BEE status and employs more than 6000 people. Following the Ma-Afrika judgement, Santam has increased its provision for contingent business interruption (CBI) by R1,7bn. Santam rates as one of the JSE's most reliable quality shares.

The company was obviously impacted by the civil unrest in July 2021. In its results for the six months to 30th June 2026 the company reported return on shareholders funds of 27% - down from the 33% reported in the previous period. Headline earnings per share (HEPS) were 1991c compared with 1885c in the previous period.

The share trades on a P:E of 10,8. It is probably the best example of a blue-chip share, with a strong balance sheet and a history of steadily improving earnings, year after year, for many years and its latest results were unusually good. These facts can be seen in the steady upward trend of its share price over the past 39 years.

In 1985 the share traded for 90c and today it trades for around R404 (3-9-26). This share should be a part of any private investor's portfolio.

IMP IMPLATS 2026-09-04 View

03-09-2026   Impala Platinum Holdings (IMP), or Implats, is the world's third largest platinum group metals (PGM) producer. It has been suffering over the past 7 years from aggressive union action and legislative uncertainty. The CEO says that they are focused "...on developing a portfolio of long-life, low-cost, shallow, modern, mechanised mining assets." This is similar to what Anglo American Platinum has been doing for the past 10 years.

The market for platinum itself has been damaged by a reduction in auto catalyst demand recently, especially for diesel trucks. Palladium and Rhodium still have strong markets, but platinum has been oversupplied on world markets. The company plans to grow its production from Zimbabwe by 14% due to the Mupani shaft coming on stream in 2022.

Its newly acquired Canadian operation should also increase production. In its results for the year to 30th June 2026 the company reported revenue up 58,1% and headline earnings per share (HEPS) of 2548c compared with 82c in the previous period. The company said, "Tonnes milled at the Group's managed operations increased by 4% to 27.48 million tonnes (FY2025: 26.29 million).

Milled grade declined by 1% to 3.75g/t 6E due to changes in ore mix, with higher throughput at Zimplats and the Impala Rustenburg South and Central shafts. The Group recorded a free cash inflow of R22.0 billion, after net cash capital outflows of R6.9 billion and ended the period with adjusted net cash (net of debt) of R22.0 billion and liquidity headroom of R37.0 billion". On the On 27th July 2026, Implats suspended operations at its Rustenburg complex due to safety concerns.  Technically, the share was in a downward trend from March 2022 to March 2024 mainly as a result of lower PGM prices, increased costs and loadshedding.

It then recovered in a strong new upward trend which came to an end in February 2026. Since then it has been falling but recently showed a new upward trend. Implats remains a volatile commodity share.

Winning Share: SSS
Opinion: BEL
The Currency  (2026-09-07)

Perhaps the best way to measure the progress of South Africa as a country is to look at our currency – especially against the so-called hard currencies of the Western World. Its strength or weakness gives a very good overall picture of how the country is doing economically, politically and in terms…

Perhaps the best way to measure the progress of South Africa as a country is to look at our currency – especially against the so-called hard currencies of the Western World. Its strength or weakness gives a very good overall picture of how the country is doing economically, politically and in terms of its image with overseas investors.

As an emerging economy, South Africa is not regarded as a poor country, but rather as one which is striving to become first world. For overseas investors this typically means a country and a currency which offers high risk and high potential return. Whereas a 10-year US Treasury Bill can offer the international investor a return of 4,8%, a South African 10-year government bond offers around 8,8% - that is 4% better, if the investor is prepared to take the risk of investing here.

We have a number of advantages over other emerging markets. Perhaps most importantly, we have relatively low inflation. In fact, due to the tireless efforts of Lesetja Kganyago, Governor of the Reserve Bank, our inflation rate is very comparable to many First World countries – and certainly far better than many of the other emerging economies. For example, Turkey’s inflation rate is 31,5%, Argentina is at 33,8% Egypt is at 14,9% and Columbia is at 6%.

We are generally grouped among those less risky emerging economies with lower inflation rates like Brazil (4,6%), India (4,4%), Mexico (3,4%), Indonesia (2,9%), and South Korea (2,8%). These are very comparable to the inflation rates of First World economies like Europe (3,3%), the United Kingdom (2,9%) and America (3,4%).

Approximately $19bn worth of rands are traded in our currency market every day on average. This makes it a highly liquid and very free currency exchange. Overseas investors can quickly take or sell large positions in what is a strong and well-organised market. This has tended to mean that the rand has become a proxy for all emerging economies. When international sentiment is risk-on they pile into our currency and government bonds. When it is risk-off, as it was when Trump began his war with Iran, they sell out quickly.

But overall, for at least the past 17 months the rand has been steadily appreciating against most first world currencies. In our view, this is related to the stabilising impact of the government of national unity (GNU) and the fact that the ANC is no longer in complete control. This together with the various initiatives set in motion by President Ramaphosa have meant that the economic environment has been steadily improving since April 2025.

On 10th April 2025 one euro would have cost you R21,90 and today it costs R18,53. On the same day, one British pound would have cost you R25,34 whereas today it costs only R21,56 and of course over the same time period the US dollar has fallen from being worth R19,75 to being worth R15,96. Consider the chart:

South African rand/US dollar : March 2025 - 4th of September 2026. Chart by ShareFriend Pro.

What is significant about this chart is that it clearly shows the steady improvement in international sentiment towards South Africa. The massive, well-informed international investors of the world are betting on our country and putting their money here instead of elsewhere. That is a significant vote of confidence and one which many South Africans caught up in the cut and thrust of daily life here do not appreciate.

In our view, the rand is about to break below its previous cycle low of R15.79 to the US$ made on 29th January 2026. The outcome of the municipal elections on 3rd November 2026 will have a significant impact. If the ANC loses further ground and the DA gains ground (which is what we believe will happen) then you can expect the rand to appreciate further.

A stronger rand is good for everyone in South Africa. It means lower fuel prices, lower inflation, lower interest rates, more stability and a better future for everyone involved in the economy. It is the most telling and reliable indicator of our progress as a nation.

Harmony Takes Off  (2026-08-24)

The gold price has been in a persistent correction since its record high on 28th January 2026. It has been in what technical analysts call a descending flag formation which we have drawn you attention to on several occasions. As with any formation we are looking for the direction of the breakout…

The gold price has been in a persistent correction since its record high on 28th January 2026. It has been in what technical analysts call a descending flag formation which we have drawn you attention to on several occasions. As with any formation we are looking for the direction of the breakout from that formation to give a clear idea of the future trend. In the case of gold, we have always been confident that it would break to the upside – and that is what it did last week on 19th August 2026. Consider the chart:

Gold price in US dollars : August 2022 - 21st Of August 2026. Chart by ShareFriend Pro.

The chart shows the US dollar price of gold since August 2022. It broke up out of a long-term sideways pattern in March 2024, and we drew your attention to that in the Confidential Report at the time. The chart shows how the upward trend was paused in 2025 until the precious metal broke above resistance at $3424 and it shows the all-time record high of $5305 on 28th January 2026.

The flag formation has taken place between two parallel downward sloping trendlines, showing how gold lost about $1000 over 5 months then found support before breaking to the upside.

As a private investor you should be thinking about which shares would have enabled you to capitalise on gold’s amazing run – and one of the best was Harmony. Of course, gold shares are always going to be speculative and risky, but under the right circumstances they can provide an excellent long-term investment.

In the case of Harmony, the key, for us, was its purchase of the Mponeng gold mine for $200m in September 2020. This was a very brave, potentially dangerous acquisition and we waited for some time before recognising that they were making a success of it. Mponeng is the deepest mine in the world. It is currently mining at depths of around 3800 meters with plans to go deeper to 4200 meters. This means that it is operating 2 kilometres below sea level from the Highveld near Carletonville. At those depths the grade is excellent - around 11,27 grams per ton – more than double the average grade for South African gold mines. The problem is that mining at those extreme depths is expensive and potentially very dangerous. It is the very definition of a high-risk, high-return investment.

We added Harmony to the Winning Shares List (WSL) on 16th November 2023 at a price of 9920c per share. It reached an all-time high of 40841c on 28th January this year before falling back as gold corrected. Since 3rd August 2026 it has been moving up strongly again as gold recovered. Consider the chart:

Harmony (HAR) : August 2023 - 21st of August 2026. Chart by ShareFriend Pro.

Harmony published an excellent trading statement on Friday last week, predicting that its headline earnings per share (HEPS) would increase by between 90% and 105% in US dollars. 

Altogether, Harmony has risen by more than 250% since we added it to the WSL nearly 3 years ago and we believe it will continue to perform well – but it remains a commodity share and hence both volatile and risky.

A New Record High  (2026-08-16)

A couple of weeks ago we wrote an article about the sideways market that the S&P500 was in at the time. In that article we pointed out that while the market had been moving sideways for three months, the actual companies which the market represented had been continuing to grow and develop. We…

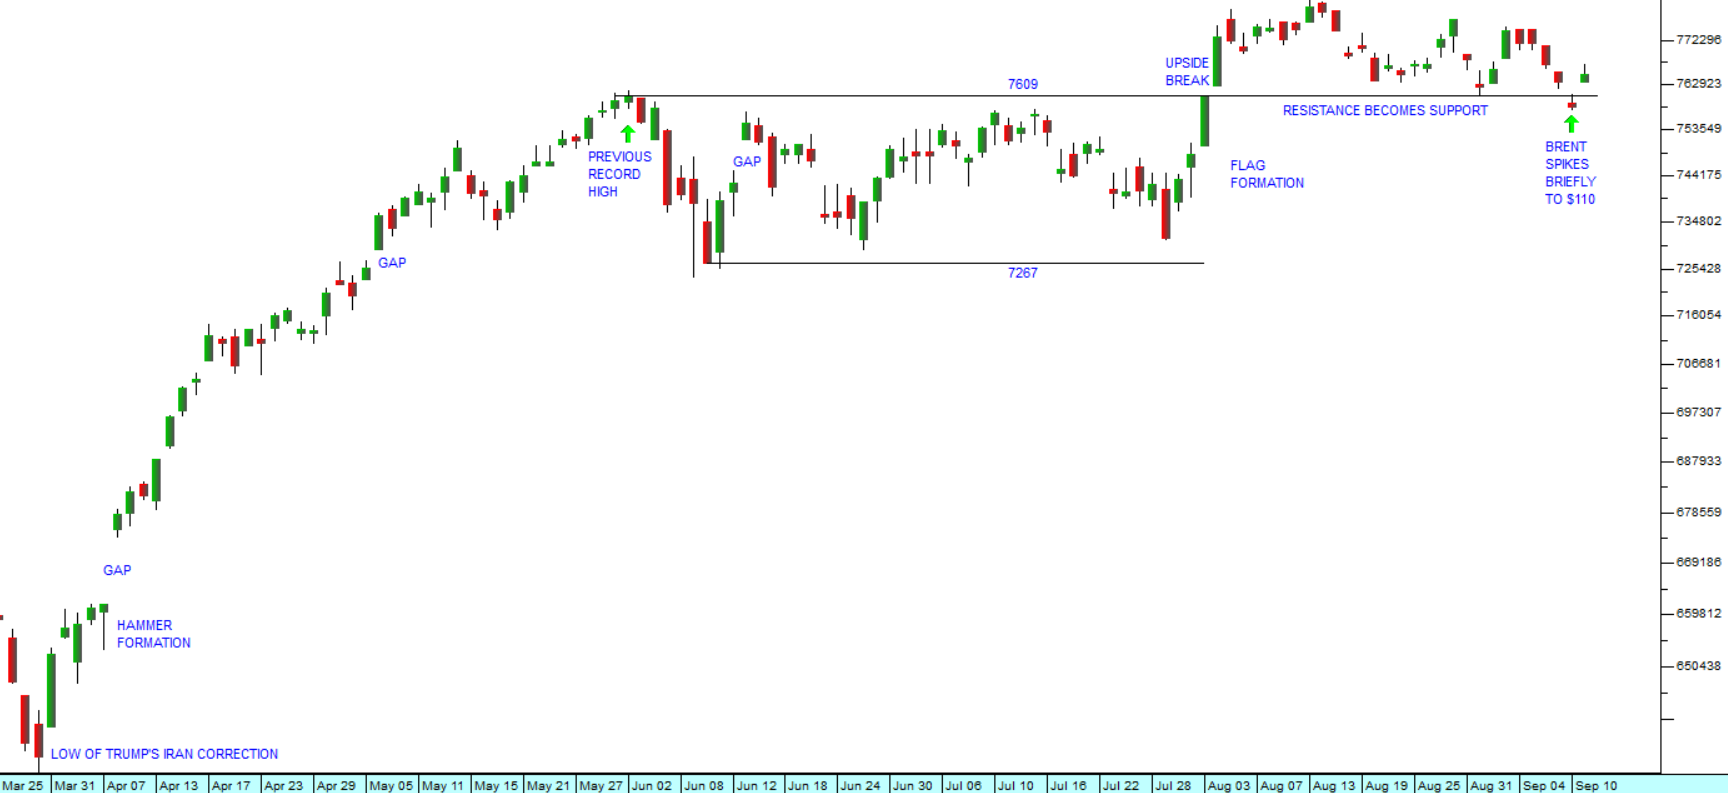
A couple of weeks ago we wrote an article about the sideways market that the S&P500 was in at the time. In that article we pointed out that while the market had been moving sideways for three months, the actual companies which the market represented had been continuing to grow and develop. We anticipated that the market would break to the upside out of that flag formation and that when it did it would have to catch up the growth of the previous three months. Consider the chart:

S&P500 Index :14th of May 2026 - 14th of August 2026. Chart by ShareFriend Pro.

The chart shows how the S&P was moving sideways between the previous record high of 7609 made on the 6th of June 2026 and the low of 7267 made on the 10th of June 2026. Then on the 4th of August 2026 the S&P broke strongly to the upside and made a series of new record highs – just as we expected.

From a fundamental perspective, lower-than-expected inflation and a slower level of job creation gave the market hope that the Federal Reserve Bank would not raise interest rates again at the next meeting of the monetary policy committee (MPC) on the 15th and the 16th September 2026. The consumer price index (CPI) fell to 3,4% in July 2026 from June’s figure of 3,5%. The drop gave investors hope that the worst of the effects of the Iran fuel price hike were behind and that inflation was again moving down.

The producer price inflation figure for the year to the 31st of July 2026 was also encouraging at 4,7% - significantly lower than June’s figure of 5,5% and reflecting the drop-off in the oil price. We believe that interest rates in America will probably remain unchanged until the end of this year.

The stalemate in Trump’s war and its impact on world oil prices appears to have stabilized with North Sea Brent Oil hovering roughly $15 per barrel above where it was before the war began. While developments in the war are still a factor, investors’ attention is back to focusing on the figures coming out of the companies which make up the S&P, especially the so-called Magnificent Seven.

In Q2 2026, Apple was the hero with earnings per share (EPS) up an impressive 29% year-on-year, followed by Microsoft’s 32% gain. Alphabet, Amazon, Meta, and Tesla delivered solid revenue, above forecast, but this was heavily counterbalanced by massive capital expenditure increases mainly for artificial intelligence infrastructure.

Nvidia is reporting its results for the second quarter in a few days’ time on the 26th of August 2026. Wall Street is anticipating another blowout quarter with analysts looking for exponential growth fuelled by the relentless demand for artificial intelligence infrastructure.

What is also clear to us is that Americans are expecting Trump and the Republicans to perform very badly in the coming November mid-term elections, almost certainly losing the House of Representatives and possibly even the Senate. If this happens, it will make Trump into a “lame dog” president, unable to pass any legislation against Democrat opposition. There is also now the clear possibility that he could be forced to resign as a result of increasingly poor health or because he is impeached.

Whatever happens it is clear that his influence over the stock market is declining rapidly. The market has lost interest in his interminable erratic announcements on Truth Social and is instead caught up in the excitement over the productivity benefits of new technologies.

We expect that the S&P will continue to climb to further new record highs and take all world markets up with it, including the JSE. 

JSE Top 40

109,270.00 (-0.01%)

All Share

116,726.00 (+0.03%)

Financial 15

26,274.00 (+0.69%)

J200
J203
J212
Top Gainers
# Code Name Close (c) % move
1 DLT DELPROP 38 +8.57%
2 SSK STEFSTOCK 610 +6.09%
3 MTU MANTENGU 23 +4.55%
Top Losers
# Code Name Close (c) % move
1 ACS ACSION 1000 -11.97%
2 PMV PRIMESERV 275 -11.29%
3 TPC TRNPACO 4200 -8.60%

Top Movers – Charts

Top Gainer: DLT
Top Loser: ACS