Candlestick charting was developed in the 1700's by the Japanese. It is the oldest charting system known to man, based upon the trading system of a man called Munehisa Homma (1724 – 1803), who became a legend during his own time, to such an extent that songs were composed and sung about his trades. The subject of candlestick charting was unknown to the Western world for about 240 years, until 1989 when it was first publicised in an article by Steve Nison. In 1991 the subject became more well known when Nison wrote a book called Japanese Candlestick Charting Techniques.
COMPONENTS OF A CANDLE
Candle charts provide the exact same data as an ordinary bar chart. The only difference is that a candle is provided with a "body" in the area between the opening price and the closing price.
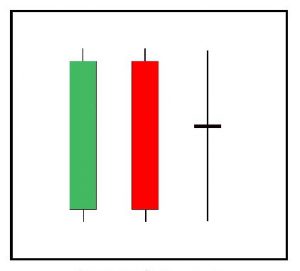
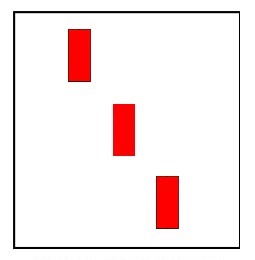
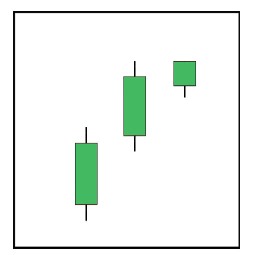
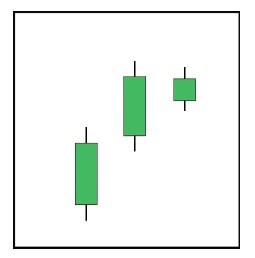
When the closing price of a security is greater (higher) than the opening price, the result is a candle with a green body (candle 1 in figure 1). When the closing price is lower (less) than the opening price, the result is a candle with a red body (candle 2 in figure 1).
When the opening and closing prices are the same, the resulting candle is called a Doji (candle 3 in figure 1).
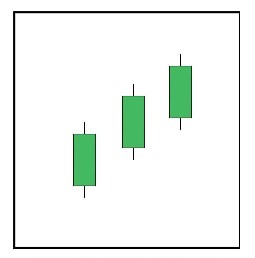
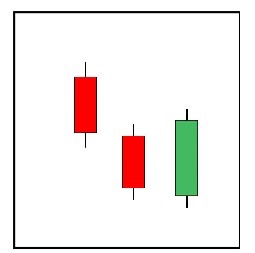
When candles have a wick, or tail, at one or both ends, these designate the high and/or low prices for the period which are above or below the body of the candle. They are called shadows. All three candles in figure 2 below have shadows. These are all green candles, which means their closing prices are higher than their opening prices. The candle on the left has shadows at both ends, which means that it had a high that was greater than the close and a low that was lower than the open.
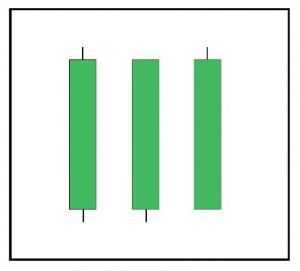
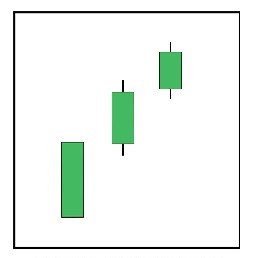
When a candle has no shadow at the upper end, as is the case with the second candle in figure 2, it is said to have a shaven head or a shaven top.
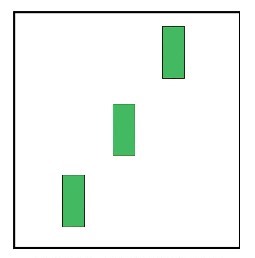
When a candle has no shadow at the lower end, as is the case with the third candle in figure 2, it is said to have a shaven bottom.
For example, consider the following chart of Prosus (PRX) for the trading days between 12th October and 19th November 2020:
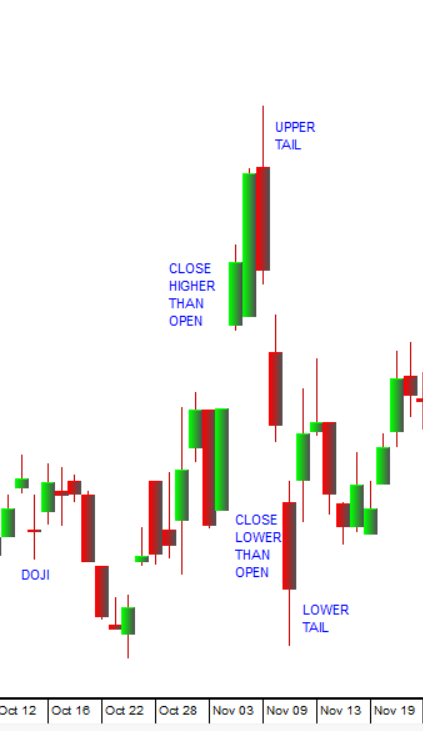
Here you can see a “doji” on the left, green candles where the share closed above its opening price and red candles where the share closed below its open. You can also see an example of an upper and lower tail.
UNDERSTANDING CANDLES
It has long been known that stock markets are driven by emotion, namely greed and fear. Greed creates buying pressure, which drives prices upward, while fear creates selling pressure, which causes prices to drop.
Candles reflect exactly what is happening in the market concerning the relationship between buying and selling pressures. When buying pressure is greater than selling pressure, prices rise and the resulting candles are green. When selling pressure is greater than buying pressure, the resulting candles are red. As soon as this simple concept has been thoroughly grasped, candle charts become very easy to read and very easy to understand.
The sizes of the bodies of the candles also play an important role in conveying the extent to which one market pressure is more dominant than the opposing pressure. For example, a very long green candle would be a clear signal that buying pressure was very strong during the period upon which the candle is based, whereas a small green body would imply that buying pressure, although dominant, was not all that strong. By the same logic, if a red candle appeared during an uptrend, it would be viewed as an early alarm, requiring closer attention, because this can only happen when selling pressure overwhelms buying pressure.
When studying candle charts, it is strongly recommended that they always be looked at from the point of view of buying pressure versus selling pressure, because this is the logic of candles. The Japanese traditionally regarded each day’s trade as a battle between the bulls and the bears.
Newcomers, when first encountering candle charts, tend to be overwhelmed by the quantity of signals and their apparent complexity. The truth of the matter is that candles are exceedingly simple and, once their logic has been understood, it will be found that they provide a market picture of extraordinary clarity.
Please note that the number “3” occurs frequently in Candle terminology. This is due to the Japanese superstitious belief that it is a very lucky number. It is misleading and should be largely ignored.
SHADOWS
In candle charts, the shadows are just as important as the bodies of the candles. There are even times when the shadows are more important than the bodies.
Guidelines for the purpose of interpretation:
- Shadows indicate uncertainty.
- Shadows indicate failure by the bulls or the bears to carry out their intentions.
- The greater the length of the shadows, the greater the degree of uncertainty and the greater the degree of failure.
- During an uptrend, the upper shadow should be regarded as the degree of failure by the bulls to dominate the market during the period upon which the candle is based.
- During a downtrend, the lower shadow should be regarded as the degree of failure by the bears to dominate the market during the period upon which the candle is based.
- During an uptrend, the lower shadow should be regarded as the degree of emerging bearishness, i.e. selling pressure dominated during the time it took for the lower shadow to form, even though the price went up and culminated in a green candle.
- During a downtrend, the upper shadow should be regarded as the degree of emerging bullishness because buying pressure dominated during the time it took for the upper shadow to form.
- An absence of shadows, i.e. when candles have both shaven tops as well as shaven bottoms, indicates that during the period upon which the candle is based, the dominant market pressure was in total control. This also implies extreme strength in the trend.
The shadows are of lesser importance during the early stages of a trend and of greater importance during the latter stages of a trend. The reason for this is because there is often a great deal of argument between the bulls and the bears in the area of trend reversals and/or market corrections. This can result in a considerable bout of price fluctuation as one market pressure resists the other or tries to gain dominance. Accordingly, the longer the duration of a trend, the more attention should be given to the size of the shadows and whether their size is increasing or decreasing. This aspect should also be kept in mind when studying or using reversal signals.
CANDLE BODY SIZE
The size of the candle bodies, relative to each other, can provide a considerable amount of information in respect of the strength or weakness of a trend.
Guidelines for the purpose of interpretation:
In an uptrend, as the trend gathers momentum and strengthens, the green candle bodies are likely to become large. During a strong trend and while the candle bodies are increasing in size, the shadows will tend to diminish and sometimes they will disappear altogether.
During a downward trend, all other points apply, but in reverse. It should also be noted that gaps during a downtrend tend to appear more frequently and also tend to be more larger in size than those in an uptrend. This is because fear is a much stronger emotion than greed. It is also the reason why downtrends tend to be much faster and sharper than uptrends.
During a weak to medium strength trend, it is likely that candle bodies will overlap each other, i.e. their opening prices could be lower than the preceding candle’s closing prices.
When an uptrend approaches the end of its run, or if it begins to weaken, the green candle bodies are likely to become smaller. Shadows, if they are absent, will reappear and they will also tend to become longer with each succeeding candle.
In a very strong uptrend, it is quite common to see candle bodies gap away from each other (i.e., the close of one day is lower than the open of the next leaving a gap), particularly during the early stages of an uptrend. This is, however, not always a healthy situation, particularly when the gaps are excessive in size. When the gap is large, it is frequently perceived as a good opportunity for taking profit. This can cause selling pressure to temporarily overwhelm buying pressure, which brings about a downward correction. Gaps that occur during the latter stages of a trend should be viewed with a great deal of suspicion.
BOTTOM REVERSAL SIGNALS
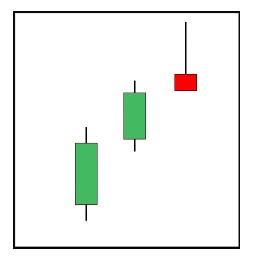
Bullish Engulfing Pattern
The Bullish Engulfing Pattern is a trend reversal signal and it implies that the trend is likely to change from bearish (downwards) to bullish (upwards). It is regarded as a particularly strong signal. It is only valid as a signal when it appears at the bottom of a downtrend.
It comes into existence when buying pressure completely engulfs the preceding selling pressure. The engulfing candle’s opening price should be at or below the previous red candle’s closing price. The engulfing candle’s closing price should be at or above the preceding candle’s opening price. Ideally, it should have short shadows or no shadows at all. In figure 8 it can be seen that the body also engulfs the shadows of the preceding red candle. Although this adds strength to the signal, it is not necessary for the purpose of validity. It will sometimes be found that the Engulfing Green will engulf more than one of the preceding red candles. When this happens, it should be regarded as an exceptionally strong signal. Western analysts also recognise this pattern, and they call it an “outside day”.
Piercing Pattern
The Piercing Pattern could be considered the younger brother of the Engulfing Green. For the purpose of validity, it should have an opening price at or below the previous candle’s closing price and a closing price that is at least half way up the body of the preceding red candle. Shadows, particularly the upper shadow, should be minimal or, ideally, absent. An excessive upper shadow on this candle detracts from the strength of the signal and should be viewed with suspicion as it implies a failure on the part of the bulls to stamp their authority on this move.
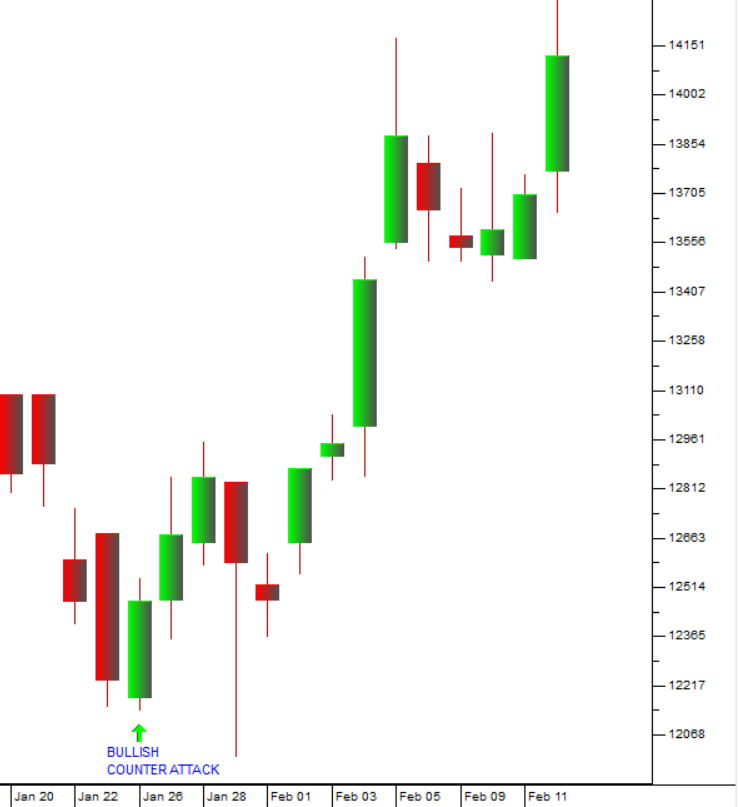
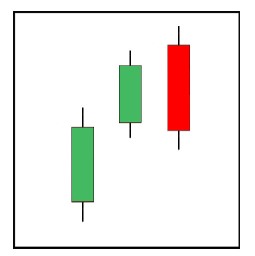
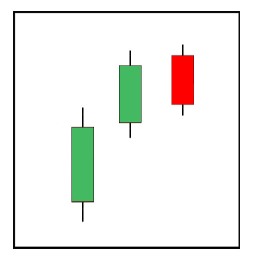
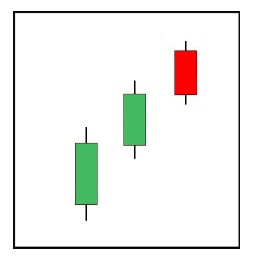
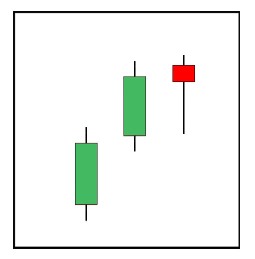
Bullish Counter Attack
The Bullish Counter Attack could be considered the baby brother of the engulfing and piercing patterns. Although it is not as emphatic a signal as the ones provided by its big brothers, it implies the same thing, and it can produce good trend reversals. Its name is derived from its action: it opens well below the preceding red candle’s closing price, giving the impression that the bears are still firmly in control of the situation, but then the gap down is perceived by the bulls as a bargain. They enter the fray and drive the price up. Although it is preferable that it closes within the body of the preceding red, this is not a condition for validity. A closing price at, or even fractionally below that of the preceding red is quite acceptable.
The following chart of Standard Bank (20th January to 11th February 2021) shows a bullish counterattack and then a following upward trend:
The Hammer
The Hammer obtains its importance and its power as a bottom reversal signal not from its body, but from its long lower shadow. The minimum requirement for validity as a hammer is that the lower shadow should be at least twice the size of the body. If it has an upper shadow, this should be small. The colour of the body is immaterial, and it can be either green or red. Green is however preferable as it adds a small amount of additional strength to the signal. The greater the length of the lower shadow, the greater the strength of the signal. This is because the lower shadow reflects the degree of failure by the bears, as well as the degree by which the bulls have defeated the bears and taken command of the situation during the period upon which the candle is based.
Shooting Star
This candle is called a Shooting Star because of its long upper shadow resembling the tail of the falling star. Its counterpart is the Hammer. The strength of its signal is based upon bullish failure.
In the next example is a candlestick chart of Prosus (PRX) for the trading days between 24th December 2020 and 10th February 2021:
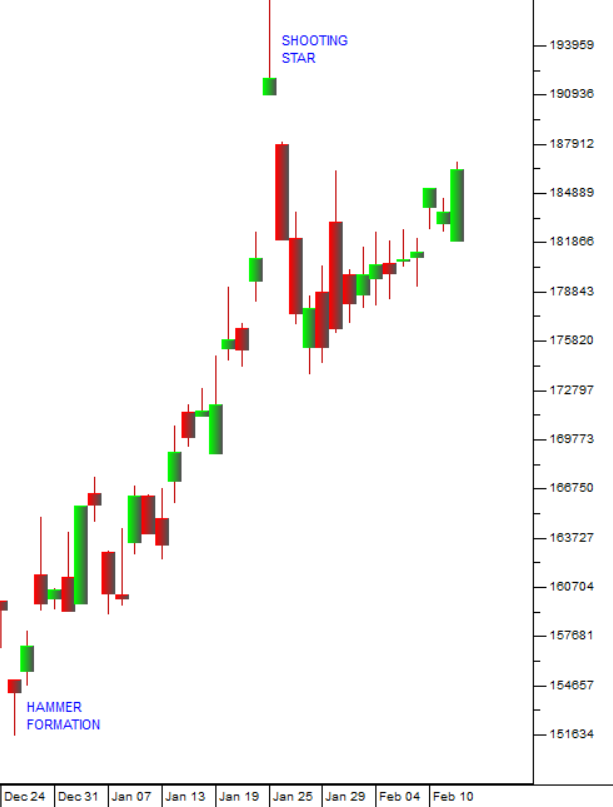
You can see a hammer formation on the left which heralds the upward trend and then a shooting star formation (the opposite of a hammer) which marks the top of that trend and the start of a downward trend.
The Inverted Hammer
The Inverted Hammer, like its counterpart the Hammer, obtains its significance from a shadow and not from its body. In this case it is the upper shadow that is important because its signal is based upon emerging bullishness. The minimum requirement for validity is that the upper shadow should be at least twice the size of the body. The lower shadow should be small, or preferably non-existent. The colour of the body is immaterial and can be red or green, although green is preferable as it adds a small amount of additional strength to the signal. It is quite common to see more than one Inverted Hammer or Hammers at the bottom of the trend. Sometimes there are also combinations of the two.
Note: Newcomers to candle charts are often confused by the fact that the importance of the Hammer is in the lower shadow, while the upper shadow is important in the Inverted Hammer. The answer to this apparent conundrum is quite simple: One is based upon bearish failure and the other upon bullish emergence. Additionally, long shadows in both directions during the same period would be a signal of uncertainty and confusion.
Tweezer Bottom
The Tweezer Bottom is not considered to be a powerful signal, but it should never be ignored, as it can presage some surprisingly strong reversals. The only criterion it has for the purpose of validity is that the lowest lows of two out of the last three candles must be the same or very nearly so. Whether the lows are shadows, bodies or a combination of the two does not matter. Nor do the colours of the bodies matter. It is also permissible for the prongs of the tweezer to be separated by another candle, as long as the separating candle’s low does not exceed the lows of the prongs. The logic of this pattern is based upon the argument that the bears have failed to drive the price lower. Additionally, because the price appears to have found a support/resistance area, the trend is likely to reverse. It is fairly common to find up to four candles at the bottom of a trend that all have identical, or near identical, lows. When this is the case, it adds strength to the signal.
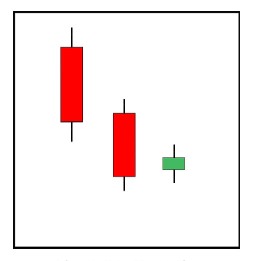
Harami
The Japanese word Harami means pregnant. As can be seen from the second and third candles in figure 15, this description is quite apt. The colour of the body of the small candle is immaterial. For the purpose of validity, the body of the small candle must be within the body of the preceding (mother) candle. An additional criterion is that the body of the baby must be small, while the body of the mother must be of at least average size. The logic behind this pattern as a reversal signal is that the bulls have halted the downtrend. The smallness of the baby’s body implies that the argument between the bulls and the bears is a very tight one that favours the bulls as they have not only already stopped the bears in their tracks, but have also managed to drive the price up from the previous low closing price. Although the shadows of the baby candle are not all that important, they should not extend beyond the opening and closing prices of the mother’s body.
There is another variation of this pattern called a Harami Cross, which is considered to be a slightly stronger signal than the Harami. The Harami Cross is the exact same signal except for the fact that the open and the close for the baby candle are exactly the same. Western analysts also recognise the Harami and call it an “inside day”. Harami and Harami Cross patterns are not considered to be powerful signals.
Please note that the Harami can be a dangerous and misleading signal due to the fact that there are Continuation Signals that begin as Harami patterns and then become something else. Considerable caution should be exercised when encountering the Harami.
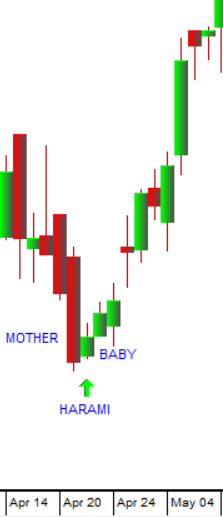
Here is an example of a Harami in Imperial (IPL) between 14th April and 4th May 2020:
CONFIRMATION OF SIGNALS
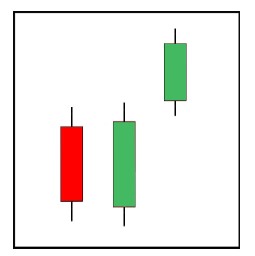
No single candle signal should ever be acted upon without confirmation, as the signal may have been false and due only to market noise. Instead of acting upon a signal, it is advisable to wait for completion of the next candle in order to see whether the price action follows the direction predicted by the reversal signal.
In the example below (figure 16), the red candle represents the last candle in the downtrend. The second candle is the reversal signal called an Engulfing Pattern. The third candle provides confirmation of the signal by way of being another green candle where each of its components, i.e., open, close, high and low, are higher than those of the preceding candle. Please note that it is not sufficient for only the closing price to be higher. If, for example, the low of the third candle had been the same or lower than that of the second candle, then it could not be regarded as a valid confirmation of the second candle’s reversal signal. When there is any doubt about the validity of a confirmation signal, it is advisable to wait for the completion of the next candle.
TOP REVERSAL SIGNALS
Top and bottom reversal signals are merely two sides of the same coin. The logic and the market conditions that bring into being the one, also bring into being the other. Bear trends are reversed when buying pressure overwhelms selling pressure. Bull trends are reversed when selling pressure overwhelms buying pressure. For these reasons and because they have been explained in detail, a thorough understanding of bottom reversal signals should be acquired before attempting to study the candle signals detailed below. The rules and guidelines for the interpretation of top reversal signals are the same as those detailed for bottom reversal signals. The only difference is that the market pressures are/have reversed.
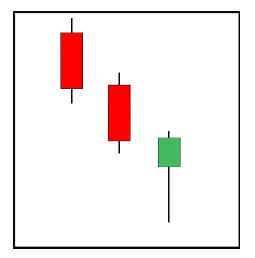
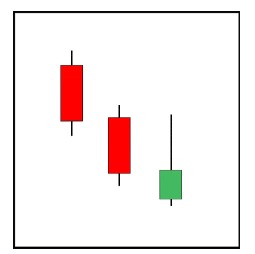
The Bearish Engulfing Pattern
The Bearish Engulfing Pattern is the counterpart of the Bullish Engulfing Pattern and it implies that the uptrend could reverse.
Dark Cloud Cover
This candle is called a Dark Cloud Cover. It is the counterpart of the Piercing Pattern and it implies that the uptrend could reverse.
Bearish Counter Attack
This reversal signal is called a Bearish Counter Attack and it is the counterpart of the Bullish Counter Attack.
Hanging Man
This candle is called a Hanging Man. The Japanese say that it looks like a man hanging from the side of the boat and feeling the depth of the water with his toes. This could also be read as the bears testing the downside. It is the counterpart of the Inverted Hammer. The strength of its signal is based upon bearish emergence.
Tweezer Top
This is a Tweezer Top and it is the counterpart of the Tweezer Bottom. Please take note of the fact that the highs of the second and third candles are identical. This is the only criterion for this signal.
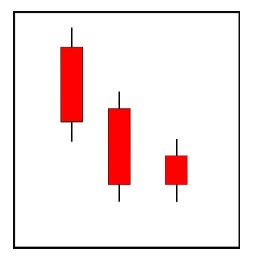
Harami
This is the Harami. Please note that this signal can be just as dangerous at the top as it can be at the bottom.
GLOSSARY TERMS:
Warning: mysqli_num_rows() expects parameter 1 to be mysqli_result, bool given in C:\inetpub\wwwroot\newage\onlinecourse\content\lecture_modules_content.php on line 21
List Of Lecture Modules