Aside from the simple moving average, described in module 23, your software offers another 4 moving average variations which are designed to improve the signals that you can get. In this module, we will examine the mathematics behind these different types of moving averages and how they can be interpreted.
We will use the same share price chart to show each different type of moving average – and we will keep the length of the moving averages the same so that you can compare how the different calculations affect them. To begin with look at a simple, 100-day moving average:
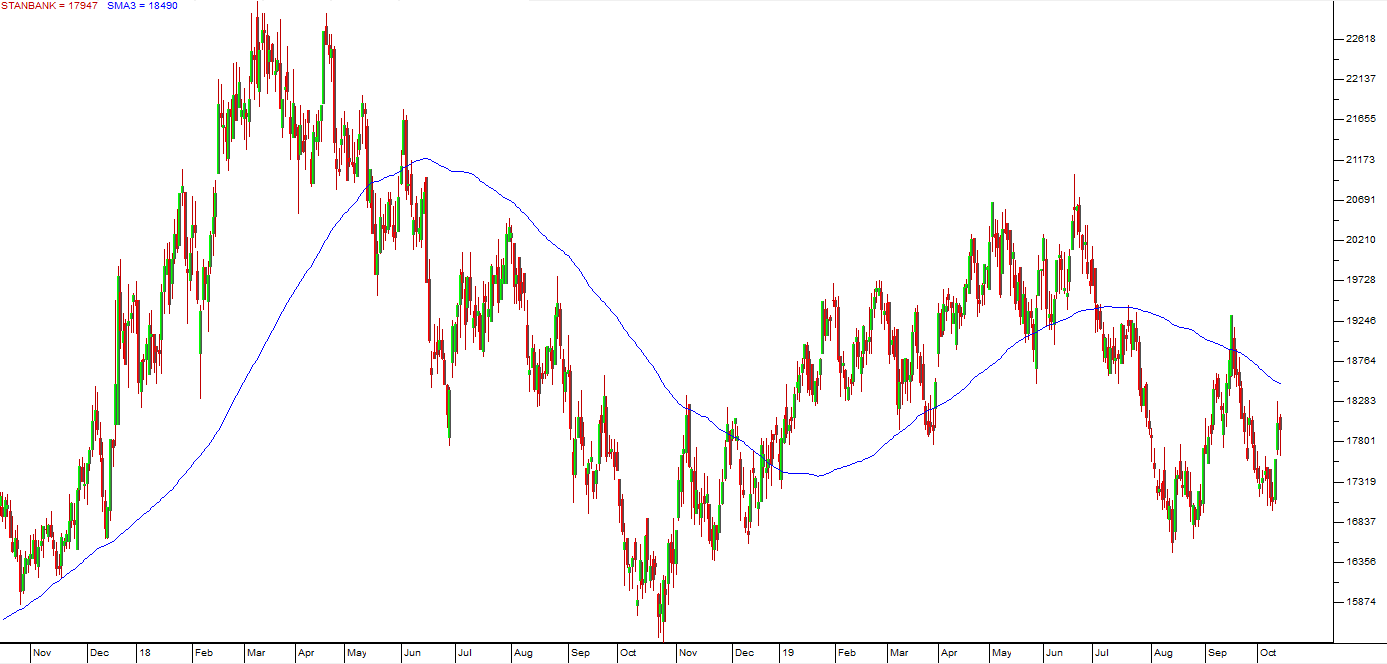
This two year chart shows the 100-day simple moving average and you can see several “buy” and “sell” signals where the price cuts up and down through its moving average. Now let us compare this with various other types of moving average.
WEIGHTED
The weighted moving average came about because technical analysts thought that it was unreasonable for the prices used in a moving average to be equally weighted. So in a simple 100-day moving average like that in the example above, the oldest price will have as much impact on the position of the moving average as the most recent. Technical analysts thought that it would be better to give the more recent prices greater weight and the older prices less.
To explain how they did this, let us consider a 10-day moving average. To calculate this all you need to do is add up the most recent ten days’ prices and divide by ten. To achieve a weighting, they multiplied the oldest price by 0,1, the second oldest 0,2 and so on until the most recent price was multiplied by 1,0. They then added up these weighted prices and divided by the total of the weightings.
If you drew a graph of the weightings, it would look like this:
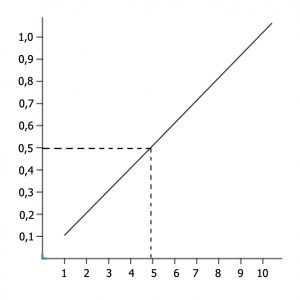
As you can see the weightings rise from 0,1 to 1,0 in a straight line. This is known as a linear weighting. Consider the moving average of the same chart with a 100-day linearly weighted moving average:
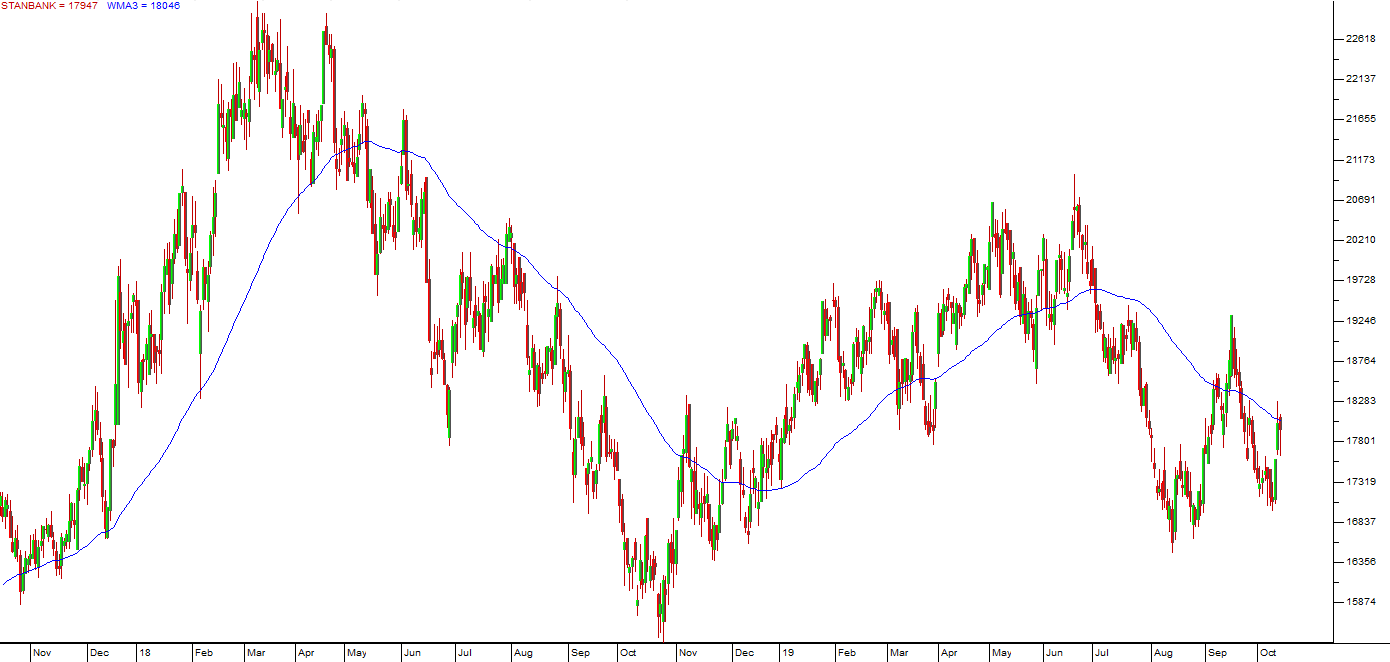
If you compare these two charts closely, you will see that the simple moving average gives its signals, buy and sell, slightly later than the linearly weighted moving average but there are more instances of "whiplash".
EXPONENTIAL
Some technical analysts thought that the linear method of weighting still did not emphasise the most recent prices sufficiently and so they suggested an exponential weighting. With exponential weighting, the oldest prices have even less effect and the more recent prices even more. Exponential weighting looks like this:
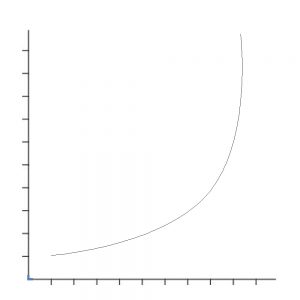
You can see here that the weightings follow a typical exponential curve. Take a look at the same chart, this time with a 100-day exponentially weighted moving average:
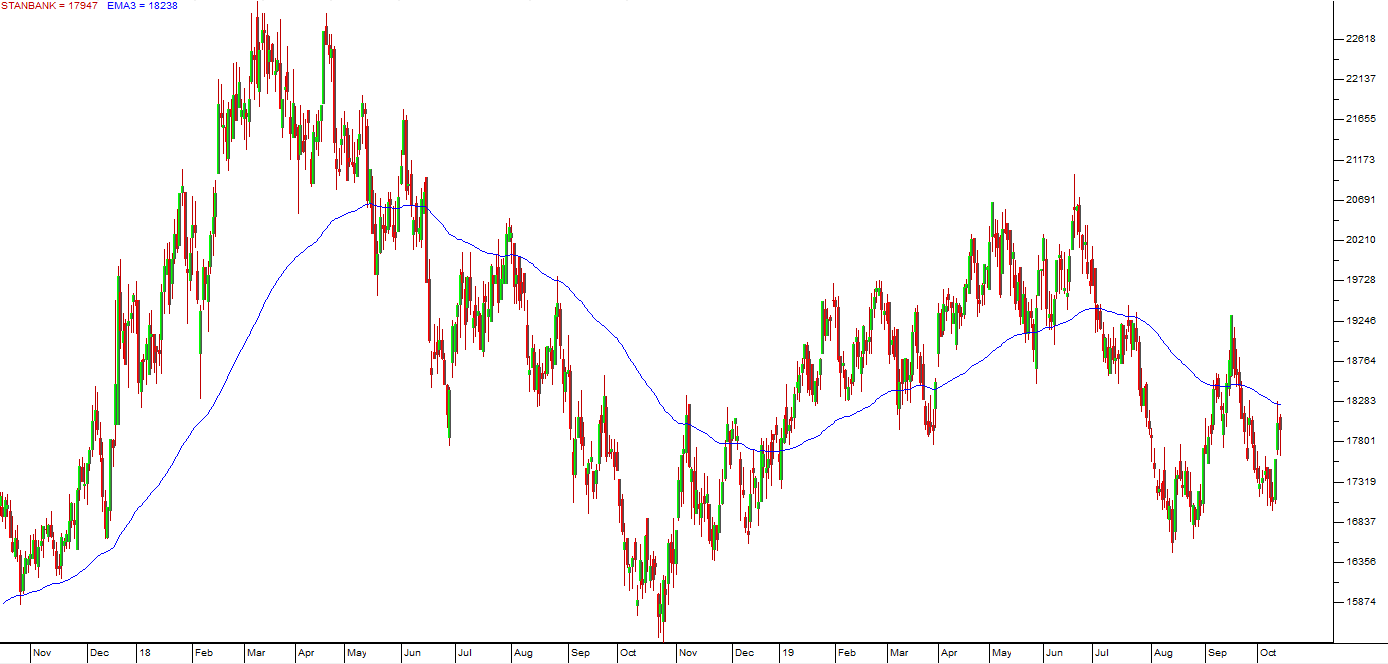
Again, close examination should reveal that the exponential moving average responds much more quickly to changes in the share price direction than either the linear weighted or the simple, but it does not necessarily give earlier signals.
Please read our article related to the 65-Day EMA here - Resilient and the 65-Day EMA
In a follow up to the above article, consider this chart:
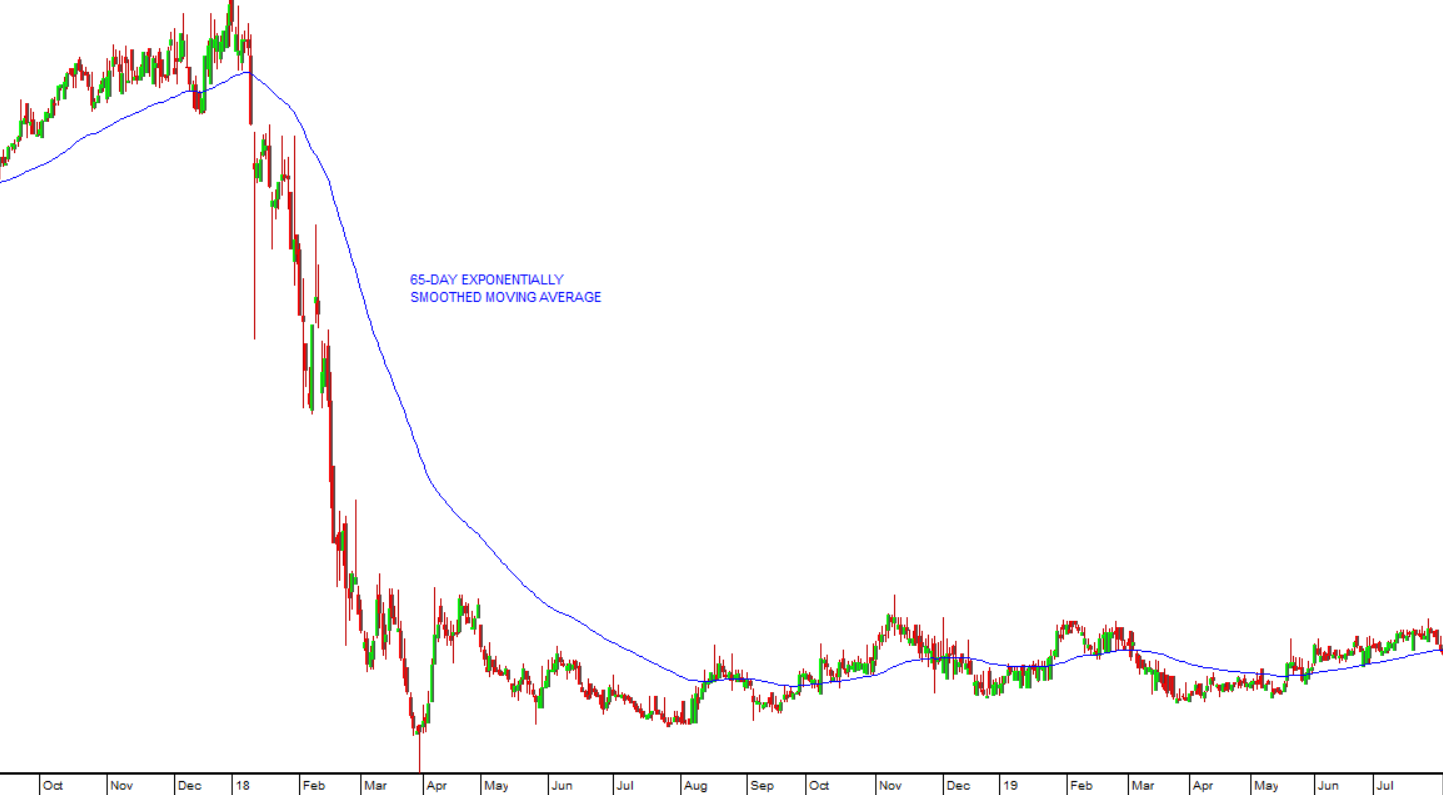
Resilient: October 2017 - July 2019. Chart by ShareFriend Pro.
You can see here that the 65-day exponential moving average did keep you out of Resilient for quite a while as it fell, but in the subsequent uptrend its signals have been subject to many whiplashes. So, when a share falls suddenly and substantially like this, the 65-day exponential often gives a very good final buy signal, but it is not particularly good at showing buy and sell signals once trade normalises again.
TIME SERIES
A time series moving average shows the end point of a regression line over a user-specified period. A regression line is a straight line drawn through a series of points (in this case share prices) such that it is in their exact centre. In other words, if you took the distances above and below the line from those points, they would exactly equal out.
So a regression line through a series of points looks like this:
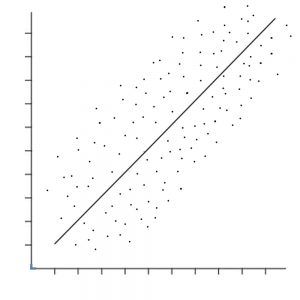
The time series moving average shows the end point of the regression line – which will obviously change every trading day as a new price is added to the series and the oldest price is removed. Consider the time series moving average of the same chart below:
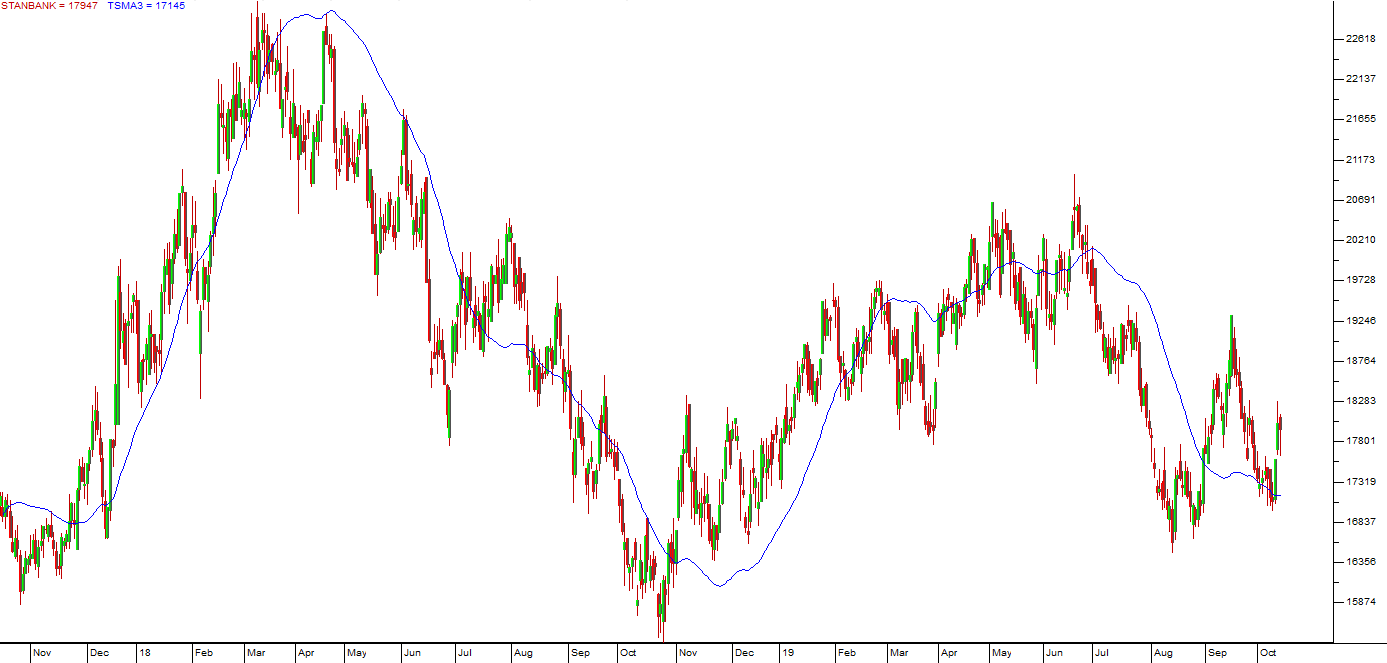
The time series moving average follows the chart more closely than the simple, the linearly weighted or the exponential, but it has a strange characteristic – which is that when the trend changes direction, it goes higher than the peak and lower than the low of the chart. This is because it maps the end-point of the regression line. But that characteristic also means that, while it follows the price chart very closely, it often avoids the whip-lashing that other moving averages tend to have.
TRIANGULAR
A triangular moving average is a moving average of a moving average. In other words, in our example, the most recent 100 moving average values are themselves added up and divided by 100 to get a triangular moving average point. The effect of this “double smoothing” is that the triangular moving average responds very slowly to changes in the share’s price. This means that it gives much later signals and is far less involved in the whip-lashes which result from volatility of the share price. Consider the example of a 100-day triangular moving average on the same share:
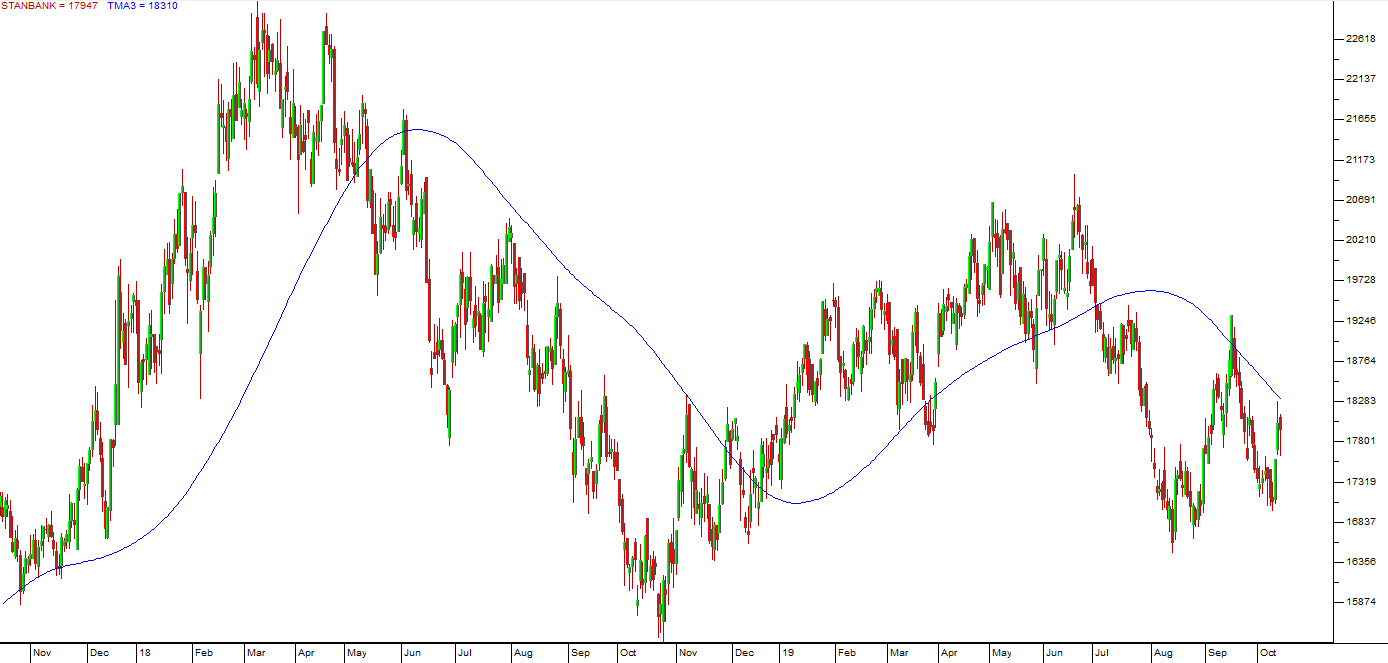
You will see immediately that the triangular moving average chart is much further removed from the price chart and much smoother. The “noise” in the chart is almost completely eliminated to reveal the underlying trends. We suggest that triangular moving averages can be used with market indexes (like the S&P500) as a good indicator of the underlying bull trends and bear trends.
Once you are familiar with these different methods of applying the moving average, you should experiment with the shares that interest you (i.e. those you have put on your watchlist) and see which moving average works best with them.
GLOSSARY TERMS:
Warning: mysqli_num_rows() expects parameter 1 to be mysqli_result, bool given in C:\inetpub\wwwroot\newage\onlinecourse\content\lecture_modules_content.php on line 21
List Of Lecture Modules