“The ultimate risk is not taking a risk”
(Sir James Goldsmith)
FUNDAMENTAL AND TECHNICAL
The risks involved in buying shares are:
- that you buy shares in a poor-quality company that has no prospects, or
- that you buy shares in a good company, but at the wrong time.
These two kinds of risk are called fundamental risk and technical risk. You will learn more about them later on in this program when you study fundamental and technical analysis.
These risks are real, whether you are planning to be an arch-speculator, jumping in and out of the market every three weeks, or an investor, buying stocks on a medium- to long-term view and only changing you holdings to protect your investments or to take advantage of the opportunities that come along. Either way, there is a danger that you will buy into a bad company or buy at a bad time — or both. To protect yourself against severe losses you should adopt a stop-loss strategy (explained in detail in a later module).
Even on a long-term view, it can sometimes take five, ten or even twenty years for blue chip shares, bought at their highest point, to return to those same highs, especially after allowing for inflation. It certainly isn’t true that, if you have a long-term view, you can forget about technical risk (i.e. the risk that the share price will fall substantially).
For example, it took blue chip shares on the JSE 22 years to reach the same levels that they peaked at just before the 1969 crash in inflation-adjusted terms. And 22 years is just too long to wait for a real return on your investments. To be successful you need to be proactive and involved – you cannot be a passive investor. You make money from your profession because you understand it and because you are involved – the same applies to the share market.
Whatever your objectives, therefore, you need to know how to spot the bargains and how to avoid buying and selling at the wrong times. To do this, whether you are an investor or a speculator, you need to be active, knowledgeable and attentive. This program is for the person who wants to be an attentive investor (the person who wants to watch the market and know what’s going on), an active investor (the person who wants to take action when the situation demands) and a knowledgeable investor.
Being active, attentive and knowledgeable will significantly reduce your risks in the share market.
SYSTEMATIC AND UNSYSTEMATIC
We have mentioned that there are both fundamental (which share you choose to buy) and technical (when you choose to buy it) risks in the share market – but there are also systematic and unsystematic risks. Systematic risk is that risk which attaches to the market itself, while unsystematic risk is the risk that attaches to a specific share. Put in a different way, the risk that the entire share market will fall in a protracted bear trend is systematic. The unsystematic risk is the risk that the particular share which you have chosen to buy in falls because of factors which are specific to that company.
To get a better understanding of systematic risk you should understand that, in a bear trend (downward trend) on the market, roughly 80% of shares will be falling while the opposite is true in a bull market (upward market). This means that in a bear market you can buy a very good, profitable share – even one which looks amazingly cheap – and yet it still falls – because the entire market is falling. On the other hand, during a bull market almost all shares will be going up irrespective of how “good” or “bad” they may be.
For this reason, it is of primary importance for you to be out of the market during a bear trend and in the market during a bull trend. So how do you know when the market is in a bull trend or a bear trend?
To answer that question, you first need to understand that these days, with the advances in communication and technology, all the markets of the world tend to move together. And they are usually led by what happens on Wall Street in America. If the New York Stock Exchange is falling, then almost inevitably the London Stock Exchange is also falling as are Zurich, Paris, Tokyo, Shanghai and the JSE.
For this reason, most of the systematic risk is focused on the long-term movements of Wall Street. As the saying goes, “When Wall Street sneezes the rest of the world catches a cold!”
From this you can see that the best way to determine whether the JSE is in a bull market or a bear trend is to study what is happening on the New York Stock Exchange. And the best way to do that is to study the progress of the S&P500 index. The S&P500 is a weighted average of the prices of the 500 largest companies trading on Wall Street – which pretty much means the 500 largest companies in the world. If those 500 shares are going up on average, then you can be just about certain that we are in or about to begin a bull trend – and vice versa.
Consider this long-term chart of the S&P500 index:
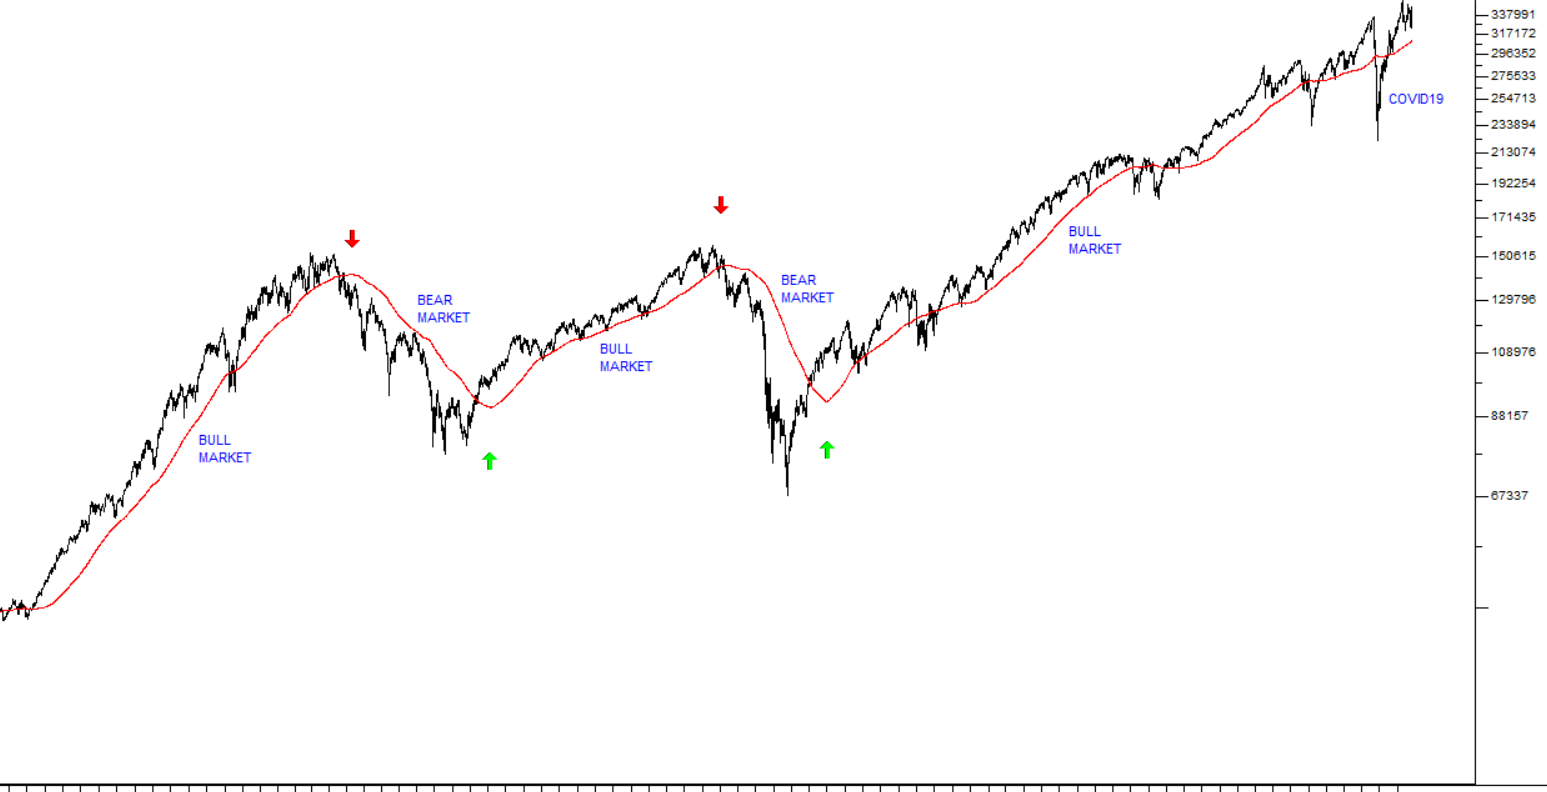
This chart shows the S&P500 index from November 1994 to November 2020. The red line superimposed on the chart is a 300-day simple moving average (MA) – which smoothes out the data to reveal the underlying trends (the calculation of the MA is explained in a later module). As you can see the index has experienced four major turning points over this 23-year period. Those four turning points are clearly shown at the points where the slope of the 300-day MA turned (highlighted by the red and green arrows).
One of the best ways to determine whether the stock markets of the world are in a bull market or bear market is to watch the slope of the 300-day MA of the S&P500 index. If that MA is rising, then you are almost certainly in a bull market and vice versa. You can see that there was a “sideways market” between June 2015 and June 2016 – where the 300-day moving average moved sideways for a year – but then the bull trend resumed.
You will also notice that during 2020, the S&P spiked down because of COVID-19. Technical analysts regard this as an “aberration” because it was caused by the pandemic rather than the underlying economy. And you can see that it did not cause the 300-day MA to fall signalling a bear trend. The bull trend continued – so that spike down was really just a buying opportunity.
The JSE does not correspond exactly with the S&P500 because of the metals and mining shares which form a large part of our market, but it is close enough. You will learn as you follow the market that if Wall Street has a bad day (it opens at between 3.30pm and 4.30pm our time and closes at between 9.30pm and 10.30pm our time – depending on daylight saving) then the JSE will almost certainly do the same when it opens at 9am the next day. The opposite is also true. The JSE, because it is an emerging market, generally tends to be more volatile than Wall Street -which basically means that it tends to move further and faster than the S&P.
So the systematic risk to the shares in your portfolio is the risk that the entire market will enter a bear trend or a correction – which will be evident in the slope of the 300-day MA on the S&P500 index.
The unsystematic risk in the particular shares that you have chosen to buy can only be assessed by studying the companies themselves. And this begins with a detailed study of fundamental analysis – which begins with looking at their latest financial statements and goes on to assess the quality of their management, the strength of their industry and their competition, technology developments in that industry, their exposure to union activity, their exposure to the strength or weakness of the rand and a dozen other factors which will influence their ability to generate profits in the future.
Sometimes it is difficult to see what is going on just from studying the fundamental factors – and then it is good to take a look at the charts (i.e. technical analysis). For example, Steinhoff (SNH), which collapsed from R55 to just R5 in December 2017, had made a very clear “declining triple top” formation more than a year earlier in 2016 – giving investors a warning that all was not right with the share. Then the Viceroy Report (published on 4th December 2017) showed that it had some serious “accounting irregularities”. Consider the chart:
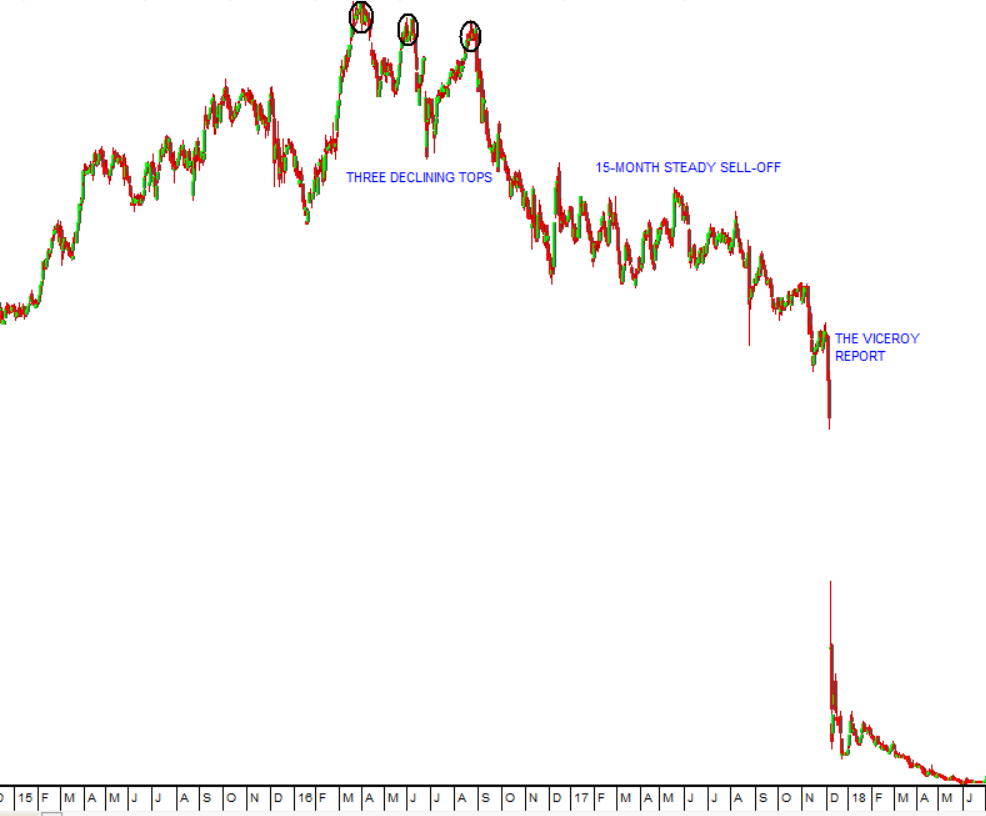
The alert private investor had plenty of time to get out of the share for purely technical reasons, even though the company’s underlying fundamental problems were not known at the time.
Technical risk is measured in the volatility of the share’s price. Clearly, the most risk-free chart would be a straight line, preferably with a gentle upward slope – but there is no such thing in the share market. Nothing in the markets moves in a straight line. There are always rallies and corrections within the major trends. However, the more your share departs from a straight line, the more volatile and riskier it becomes. Obviously, capital gains are easier to make with volatile shares – but then so are capital losses. The age-old rule of investment is that:
Risk and return rise together.
The riskier an investment, the higher the potential return should be – to reward the shareholder for taking that extra risk. If two investments have the exactly same return, then, clearly, the one with lower risk is the preferable investment.
So you need to look for high-quality shares (also called blue-chips) which are (for some reason) trading at a significant discount. The high quality of the share will minimise your fundamental risk, and the fact that they are well off their highest price will mean that your technical risk is also minimised.
The problem is that everyone else is looking for the same type of share – so usually when a share has very low fundamental risk it will also be trading at a high point in its cycle – which may mean that the technical risk is also relatively high. But you can usually eliminate systematic risk by just making sure that the market is in a bull trend.
Once you have established that, then spend some time reading through the company’s latest results (all listed companies’ financials can be downloaded in a PDF form). The more you know about the company, the lower your unsystematic risk will be.
Warren Buffett has famously said about the share market, “You should be greedy when others are fearful and fearful when others are greedy”. This, of course, also means that at the time that you buy a share you should be able to “feel the risk” – because everyone else will be negative about the share. But if you wait until everyone is positive, then you may well miss your opportunity.
GLOSSARY TERMS:
Warning: mysqli_num_rows() expects parameter 1 to be mysqli_result, bool given in C:\inetpub\wwwroot\newage\onlinecourse\content\lecture_modules_content.php on line 21
List Of Lecture Modules