The Price:Earnings Growth Ratio
As we have already said in earlier modules, a company which is growing its profits faster than others should tend to enjoy stronger share price growth.
The problem with this idea is that the company’s shares may have already moved up in price by the time we come to realise that its profits are growing faster. Nonetheless, the market often “forgets” or “overlooks” a particular share and its share price lags behind the growth rate of its profits, which gives us an opportunity to buy it cheaply. Then, as the market realises its mistake, and begins to buy up the share, we can make a capital gain as the share price rises.
So how can we tell, with a realistic degree of certainty, which shares are under-priced in relation to their historical earnings before they appreciate?
This problem has pre-occupied investors for as long as markets have been around. Wouldn’t it be great to know which shares were going to rise before they do? Of course, this is the alchemist’s dream. There is no way of consistently foretelling the future and you will always make mistakes. But there is a great deal you can do to reduce the number of mistakes you make and to minimise the effect of your mistakes when you make them. By doing this you will be bending the odds significantly in your favour.
You can take a rudimentary stab at it by using past earnings growth to determine likely future growth. And this brings us to an axiomatic truth:
The only way to predict the future is by studying the past.
You can predict with a fair degree of certainly that the sun will rise tomorrow because you have seen it happen before – many times. If you had not seen it before, you would not know that!
Using what you learn in this lecture, you will be able to establish which companies have a low market price relative to their earnings growth. The formula is the P:E ratio divided by the average percentage headline earnings per share (HEPS) growth, which gives us what is called the “Price:Earnings Growth Ratio” (or PEG).
Consider the following example (FIGURE 1) of Standard Bank at the close of trade on Friday 4th December 2020:
FIGURE 1
| Year | HEPS | Growth (c) | % |
| 2011 | 713.20 | ||
| 2012 | 857.00 | 143.80 | 20.2 |
| 2013 | 1019.30 | 162.30 | 18.9 |
| 2014 | 1110.90 | 91.60 | 9.0 |
| 2015 | 1317.70 | 206.80 | 18.6 |
| 2016 | 1394.50 | 76.80 | 5.8 |
| 2017 | 1440.10 | 45.60 | 3.3 |
| 2018 | 1640.00 | 199.90 | 13.9 |
| 2019 | 1748.40 | 108.40 | 6.6 |
| 2020 | 1766.70 | 18.30 | 1.0 |
| Total | 97.34 | ||
| Average | 10.82 | ||
| P:E | 8.91 | ||
| PEG | 0.82 |
The right-hand column of FIGURE 1 shows the percentage growth in the earnings from year to year over this period. So, Standard’s 2012 HEPS was 20,2% more than 2011’s HEPS and 2013 was 18,9% more than 2012 and so on.
Then, adding up the percentage earnings growth figures for the 9 years from 2012 to 2020 we come to 97,34 – which gives us an average percentage growth of HEPS over that period of 10,82%.
That is then divided into the current P:E ratio of the company to get its price:earnings growth ratio or “PEG” (8.91/10.82) – which in this case is 0,82.
Generally, the lower the PEG ratio the better value the share represents. PEG's below 1 are regarded as under-priced while PEG’s over 1 are over-priced.
The chart which follows shows Standard Bank’s share price chart in the top half and its price:earnings ratio (P:E) in the bottom half:
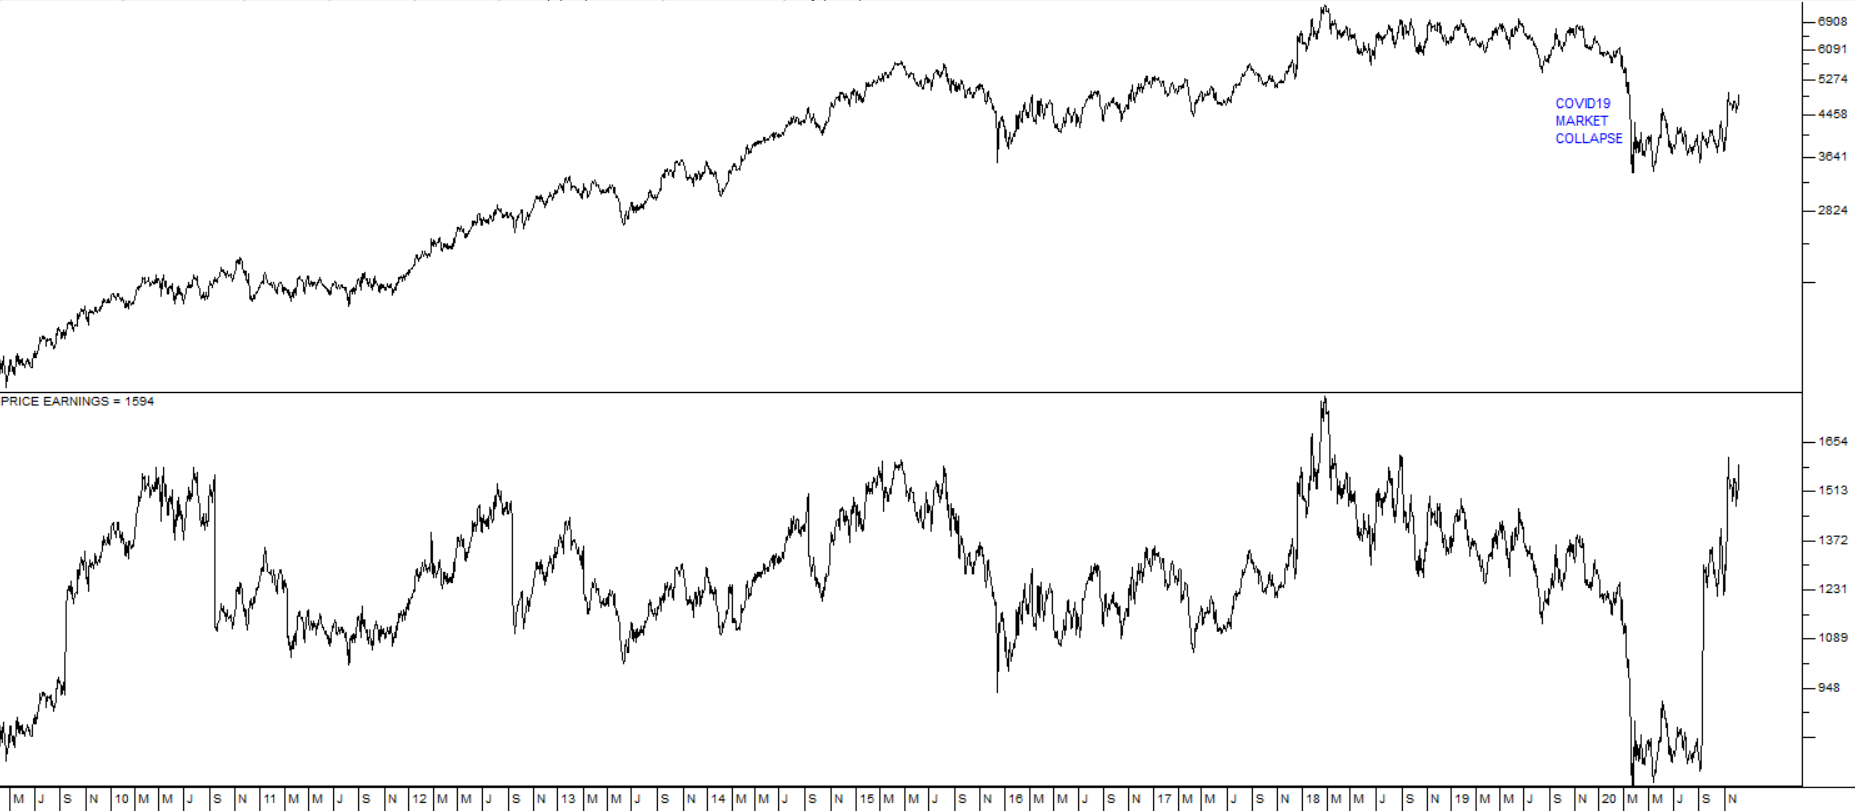
Standard Bank: March 2009-December 2020. Chart by ShareFriend Pro.
By studying this information in conjunction with the percentage growth of its HEPS, you can see that in the 8 years before the COVID-19 pandemic in 2020, this company performed well and its share price rose steadily to reflect that – and then in 2020 the company was forced to make massive provisions for potential bad debts which meant that it had only 1% growth in HEPS in that year.
This caused the P:E to fall sharply and for a while the share traded on a P:E of between 6,6 and 9. Then as investors realised that the pandemic would probably end in 2021 with the advent of vaccines, they began to bid the share up again and the P:E rose sharply.
But to establish whether Standard represents good value at the current price we need to consider its earnings track record in relation to its current P:E ratio – by looking at its PEG ratio.
The PEG shows that, at the time of writing (4th December 2020), Standard Bank’s PEG was below 1 at 0,82 – which means it was very good value at its price at the time which was 4924c.
These calculations are obviously heavily affected by the period of time over which you consider the company’s HEPS. In the case of Standard Bank in the example above, we had 10 years of HEPS which meant that we could calculate the percentage growth for 9 years. But many companies on the JSE do not have such long track records. There is nothing wrong with calculating the PEG ratio from earnings track records which are shorter than this – but obviously the further back you can go the more reliable the figures become. Using a shorter period changes the PEG quite dramatically. For example, in the case of Standard, if the PEG is calculated using earnings figures from 2015 to 2020, the PEG works out to 1,45 – which is obviously far less attractive.
So, when doing these calculations, you need to think about the period of time over which you make the calculations. Taking the longer picture, Standard’s PEG obviously benefits from the fact that it has a very long track record of steadily rising HEPS – which helps to off-set and dilute the bad 2020 figure. Another company might only have been listed for 6 years and so have a far shorter track record of profitability. That does not necessarily mean that it is a less interesting share – perhaps just that it is less well established.
ANOTHER EXAMPLE
The true value of the PEG ratio is that it enables you compare different blue-chip shares, based on their value. We have seen in the above example, how Standard Bank was relatively cheap in terms of its price: earnings ratio and earnings track record, but how did compare to other shares – and more specifically to other banks at the time?
The following table shows the PEG ratio of Firstrand Bank (FIGURE 2) on the same day:
FIGURE 2
| Year | HEPS | Growth (c) | % |
| 2011 | 183.10 | ||
| 2012 | 231.50 | 48.40 | 26.4 |
| 2013 | 279.60 | 48.10 | 20.8 |
| 2014 | 340.40 | 60.80 | 21.7 |
| 2015 | 381.40 | 41.00 | 12.0 |
| 2016 | 399.20 | 17.80 | 4.7 |
| 2017 | 423.70 | 24.50 | 6.1 |
| 2018 | 472.70 | 49.00 | 11.6 |
| 2019 | 497.20 | 553.20 | 117.0 |
| 2020 | 308.90 | -188.30 | -37.9 |
| Total | 182.53 | ||
| Average | 20.28 | ||
| P:E | 15.94 | ||
| PEG | 0.79 |
The two banks are very comparable on a fundamental basis and as you can see from Firstrand’s figures there is now not much to choose between them based on their PEG ratios – both appear to be cheap.
Let us compare these two banks with Capitec (FIGURE 3), which by the year 2020 was becoming just as big as the other four banks, but had a better earnings track record:
FIGURE 3
| Year | HEPS | Growth (c) | % |
| 2011 | 757.00 | ||
| 2012 | 1125.00 | 368.00 | 48.6 |
| 2013 | 1519.00 | 394.00 | 35.0 |
| 2014 | 1752.00 | 233.00 | 15.3 |
| 2015 | 2209.00 | 457.00 | 26.1 |
| 2016 | 2787.00 | 578.00 | 26.2 |
| 2017 | 3281.00 | 494.00 | 17.7 |
| 2018 | 3858.00 | 577.00 | 17.6 |
| 2019 | 4577.00 | 553.20 | 14.3 |
| 2020 | 5428.00 | 851.00 | 18.6 |
| Total | 219.47 | ||
| Average | 24.39 | ||
| P:E | 15.41 | ||
| PEG | 0.63 |
You can see here that Capitec’s HEPS for the ten years are better than either Firstrand or Standard. Its PEG of 0,63 puts it well ahead of its rivals as being a good buy.
But how do these banks compare with other non-bank shares in terms of their PEG's?
Growthpoint (FIGURE 4) is one of the JSE’s largest real estate investment trusts (REIT) and it has been an institutional favourite for many years. Take a look at its PEG:
FIGURE 4
| Year | HEPS | Growth (c) | % |
| 2011 | 104.52 | ||
| 2012 | 72.69 | -31.83 | -30.5 |
| 2013 | 138.67 | 65.98 | 90.8 |
| 2014 | 154.24 | 15.57 | 11.2 |
| 2015 | 149.42 | -4.82 | -3.1 |
| 2016 | 140.57 | -8.85 | -5.9 |
| 2017 | 179.66 | 39.09 | 27.8 |
| 2018 | 159.84 | -19.82 | -11.0 |
| 2019 | 158.10 | -1.74 | -1.1 |
| 2020 | 79.93 | -78.17 | -49.4 |
| Total | 28.74 | ||
| Average | 3.19 | ||
| P:E | 15.39 | ||
| PEG | 4.82 |
You can see here that over the same ten-year period going back to 2011, Growthpoint’s earnings track record has been dismal and erratic. This resulted in it trading at the lowest price it has been at over the ten years and at just over half its net asset value (NAV) of 2307c. The PEG ratio of a whopping 4,82, however, shows that it is still heavily over-valued in the market – even at these low prices. Certainly, the three banks we have considered above represented far better value.
Another institutional favourite share is Clicks (Figure 5). It is a very high-quality blue-chip share which has a long track record of producing spectacular returns.
FIGURE 5
| Year | HEPS | Growth (c) | % |
| 2011 | 250.10 | ||
| 2012 | 273.50 | 23.40 | 9.4 |
| 2013 | 302.00 | 28.50 | 10.4 |
| 2014 | 341.70 | 39.70 | 13.1 |
| 2015 | 399.20 | 57.50 | 16.8 |
| 2016 | 462.40 | 63.20 | 15.8 |
| 2017 | 536.30 | 73.90 | 16.0 |
| 2018 | 609.50 | 73.20 | 13.6 |
| 2019 | 675.20 | 65.70 | 10.8 |
| 2020 | 754.30 | 79.10 | 11.7 |
| Total | 117.71 | ||
| Average | 13.08 | ||
| P:E | 32.31 | ||
| PEG | 2.47 |
You can see here that its earnings have grown very steadily throughout the ten years even including the 2020, the year of the pandemic. But the PEG ratio is telling us that at current levels it is fully priced, even expensive. It was trading on a P:E of 32,31 on Friday 4th December 2020 –about double the P:E of Standard, Firstrand or Capitec on the same day.
PROBLEMS WITH RATIOS BASED ON EARNINGS
If you do not have an accounting background, you may find some of the accounting concepts, especially EPS and HEPS in this last section difficult to understand. You should persist and try to grasp what you can.
It is important to note that what constitutes a fair measure of a share’s real value is a subject of intense research and debate within the investment community. Investment analysts tend to use EPS or HEPS in relation to share price (i.e. with the Price-Earnings ratio) because it is so accessible (through the daily newspapers and online), but there are inherent flaws in this ratio.
Earnings is an accounting concept which does not consider the amount of “free cash” (i.e. that cash left over after all current expenses and liabilities have been paid out) flowing through the company. To arrive at an “earnings” figure we must deduct from sales a whole list of items which includes raw materials, marketing expenses, head office expenses, tax, goodwill written off (i.e. intangible assets, which are generally amortised over a period), research and development and advertising costs. The list, of course, is much longer than this.
Depreciation, for example, is merely a provision for the replacement of an asset. Assets such as vehicles are usually depreciated over three or five years, and this figure is deducted from profits even though no money leaves the company. “Deferred tax” is a similar provision. It is a provision for a future liability, but the cash remains available for use within the company. By adding them back to profits we would get a much higher “earnings” figure, or what is more properly called “free cash flow”.
Accountants will argue that goodwill write offs, advertising and R&D (research and development) are incorrectly treated as expenses when in fact they are part of the company’s capital in the same way as machinery and buildings. An “expense” is generally defined as an item which has no long-term value and so should be deducted when determining the company’s profits.
The definition of a capital item is an item which has more than a transient value to the company. Clearly, goodwill, R&D and advertising are by their very nature long term.
The balance sheet, as we know it, is an accounting concept which is designed, inter alia, to inform creditors and bankers how much they can realistically reclaim if the company goes into liquidation. It generally puts no value on the goodwill of the business (is the Steers brand really worth nothing?), its advertising spend (is R30m spent a year on advertising worth nothing to the long-term future of the company?) and research and development (is new product development worth nothing to the long term future of the company?). There is no doubt that these items are all vital to the long-term future of the company and that perhaps, instead of treating them as expenses, we should treat them as capital investments and therefore place them on the balance sheet (which we shall learn more about later).
If, instead of treating these items as expenses, we treated them as capital items, we would remove them from the income statement and place them on the balance sheet, and we would have a very much higher “earnings” figure. This is the difference between the accounting and economic methods of valuation.
Unfortunately, the accountants “rule the seas” and we are forced to use their definition of earnings. But, as an investor, you can always improve on this by finding out how much a company spends on advertising and R&D and whether its R&D spending is resulting in any product or systems improvement.
Earnings, EPS, earnings yield, PEG and dividend yield have their limitations as measures of share value and should never be considered in isolation from the other tools of fundamental analysis. Put together, however, they can provide a powerful and dynamic insight into the company and its future potential.
FINANCIAL YEAR-ENDS
Another problem with using company earnings or ratios which include company earnings (like the P:E, DY, EY and PEG) for comparisons is that companies have different financial year-ends. So, you may be comparing a company which has just produced good earnings with a company which is just about to – but is still using its previous earnings figures in its earnings ratios. So, when using ratios which depend on earnings to compare companies, it is always good to establish when their respective financial year-ends are.
CONSERVATISM
Company earnings figures are taken from their most recently published financial statements which are produced by their accounts department and audited by an external auditor. This should give investors some comfort, although the JSE has many examples of “accounting irregularities” in ostensibly blue-chip companies like Steinhoff, EOH and Tongaat, which should give one pause.
But the main problem with financial accounts and the earnings which result from it is that every company has a different way of doing the calculations. Despite the efforts of the Companies Act and Generally Accepted Accounting Practice (GAAP), there remain many “grey areas” in the calculation of earnings. Some companies are very conservative and only recognise sales when the cash is in the bank, others recognise the sale as soon as it is made. This is a particular problem with construction companies which can take years to complete a project. When should they recognise the income from a long project - when it is contracted, as the project progresses or at the end, when the cash is finally in the bank? Variations in the methods used to calculate earnings can make it difficult for investors to reliably compare companies based on their earnings ratios.
GLOSSARY TERMS:
Warning: mysqli_num_rows() expects parameter 1 to be mysqli_result, bool given in C:\inetpub\wwwroot\newage\onlinecourse\content\lecture_modules_content.php on line 21
List Of Lecture Modules