Overbought Oversold
15 August 2022 By PDSNETTechnical analysis or charting is the study of group investor behaviour. The patterns which exist in charts are derived from the behavioural characteristics of investors acting as a group. For example, the moving average technique exploits the fact that people have difficulty in adjusting their perceptions of value – quickly (If you are unclear on how the moving average works, go back and re-read module 23).
If I told you that your house was suddenly worth nothing, you would have a great deal of difficulty accepting that, even if I was right. The most traumatic experience is to write off a motor car – because what was worth R300 000 a few minutes ago is now a worthless heap of scrap metal. In our lives we come to believe that assets do not lose their value quickly.
If you own a share which is trading on the JSE for R20 in the morning, you definitely would not sell it for R1 in the afternoon. But if it was overpriced at R20, you might accept R19 for it in the afternoon, and if you were still holding it on the next day, you might accept R18 – and, in fact, it might eventually reach a price of R1 – but it would never do so in one day, but over a period of weeks and months.
This means that mathematically, the share price would have to cut down through its moving average, giving you a clear sell signal long before it reached R1. The moving average works precisely because investors as a group find it difficult to adjust their perceptions of the value of a share quickly. Most of the time, this causes share prices to move in broad sweeping trends, either up or down – and to the extent that they do, the moving average works well, giving timeous buy signals and sell signals.
A refinement of the simple moving average is the overbought-oversold indicator (OB/OS). If you need to read up on this indicator, it is explained in module 27. The OB/OS is a method which exploits the fact that people generally over-react to developments in the market, both on the upside and the downside. The OB/OS enables us to quantify those over-reactions in the context of the historical performance of the share or index.
Consider the following chart of the OB/OS of the S&P500 index against a 200-day moving average over the past 26 years back to 1997.
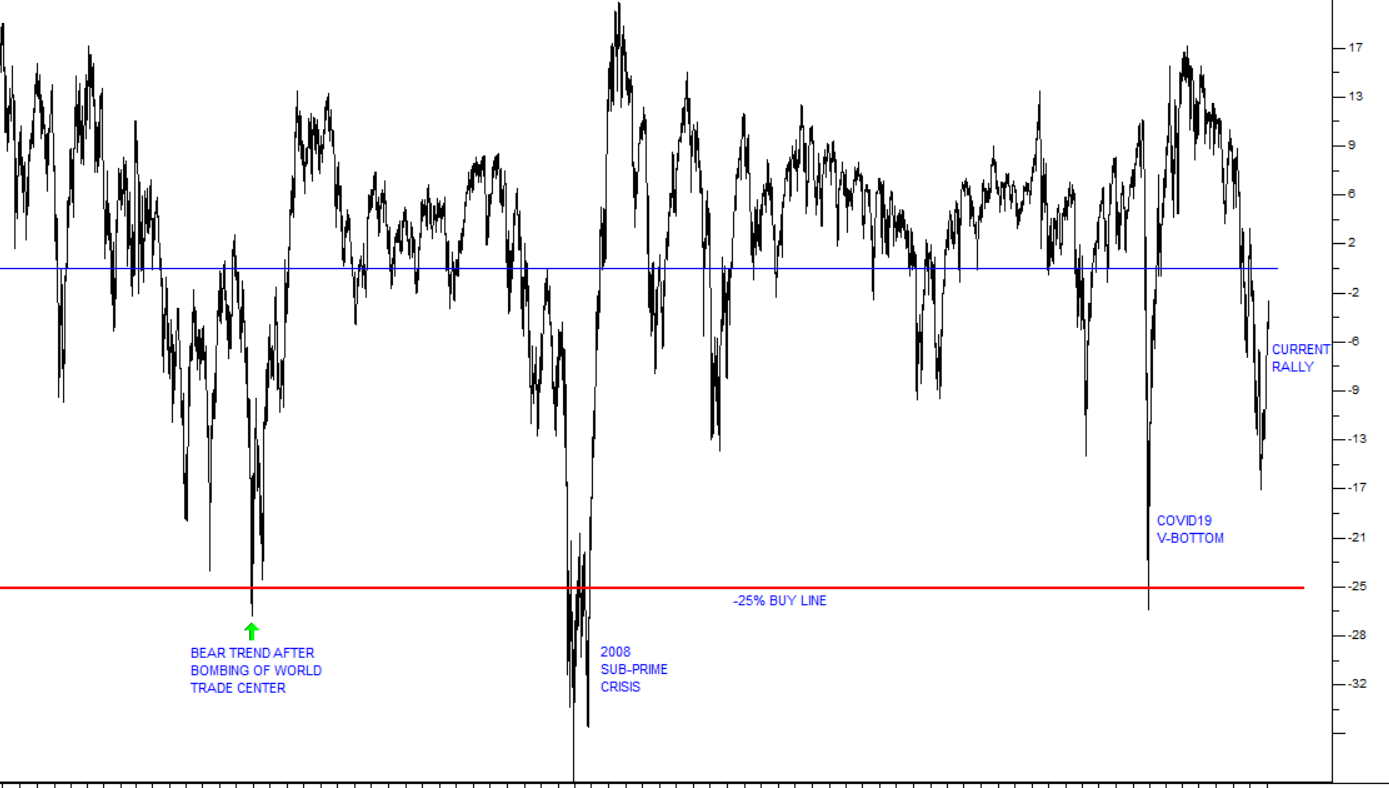
You can see here that, historically, the OB/OS oscillates above and below the zero line (the blue horizontal line) as the index is either overbought or oversold. Occasionally, it gets down to an OB/OS of -25% which we have designated as a “buy line” (the red horizontal line).
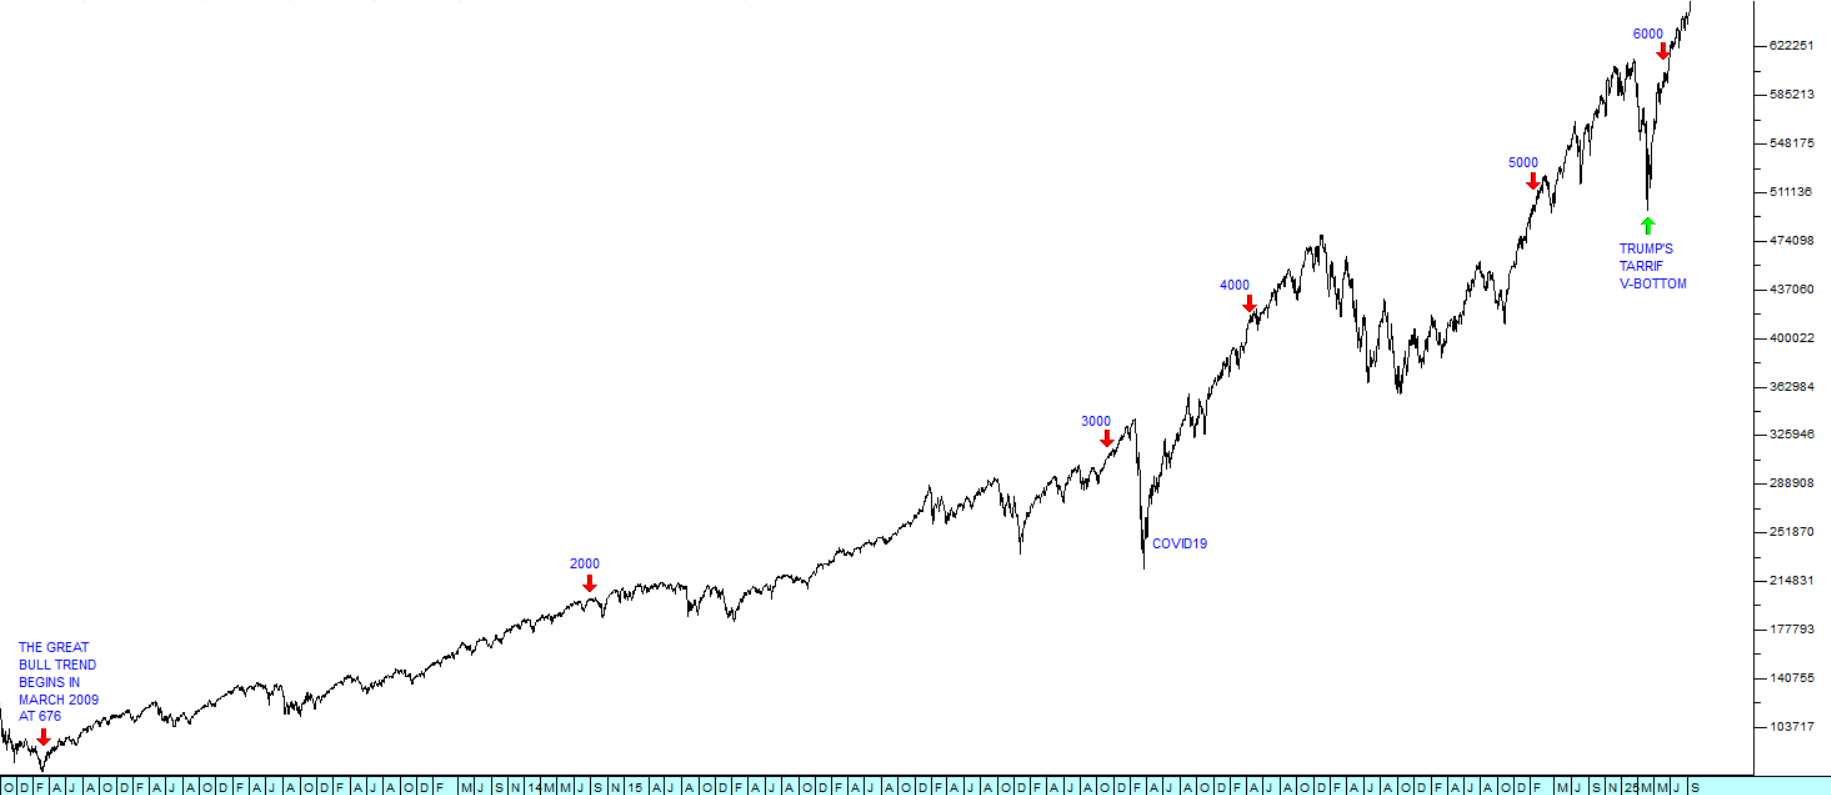
The chart shows that the S&P has only fallen below the -25% buy line 3 times in the last quarter of a century:
- in the bear trend following the 9/11 bombing of the World Trade Center in New York in 2002,
- in the bear trend associated with the sub-prime crisis in 2008, and
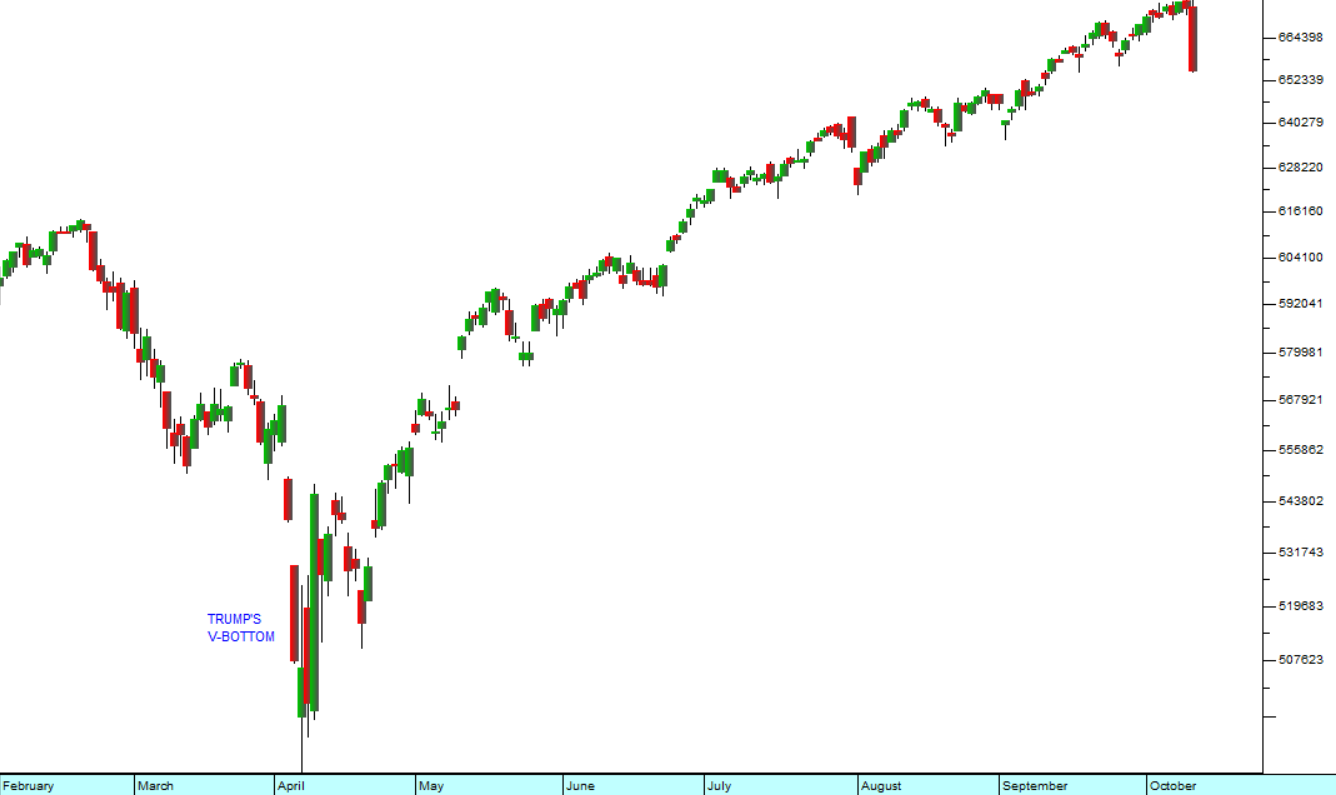
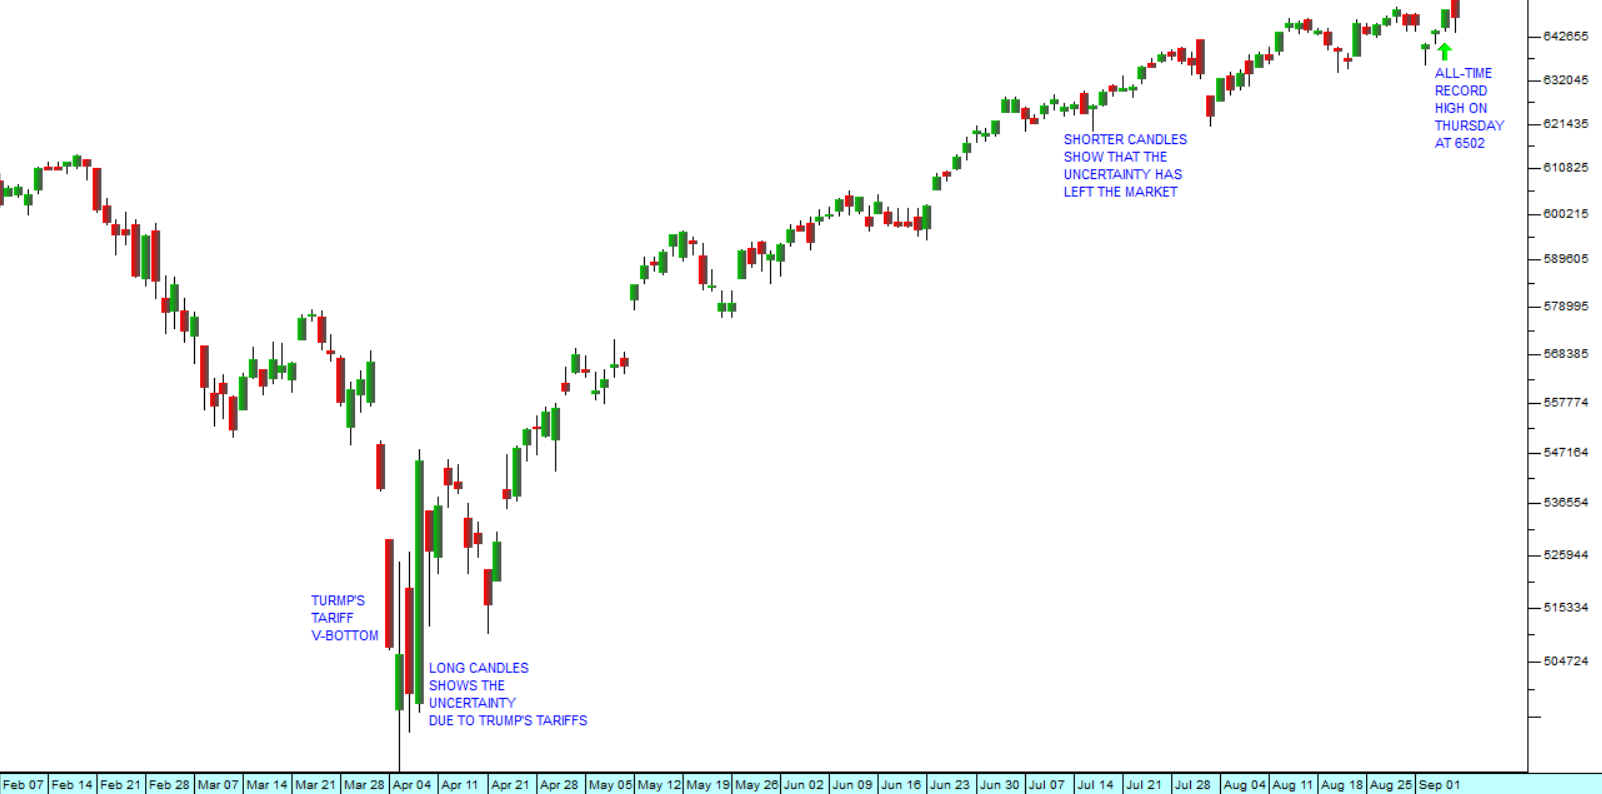
- as a result of the V-bottom following the advent of COVID-19 in March 2020.
Over the 34 years of data that we have for the S&P, it has spent less than 2% of its time below that -25% buy line. For that reason, your statistical probability of being wrong in buying the S&P when it is below that level is extremely low – and certainly, if you bought there, you would be doing far better than someone who bought when the OB/OS was above +20%. And somebody certainly did buy it when it was above +20%, because otherwise the chart would not have reached that level.
The chart also shows that the OB/OS is currently in a downward trend, which began at the start of 2021 and has not yet reached the -25% buy line. It is also possible to see that the recent bullish surge on the extreme right-hand side of the chart is probably just a rally within an overall bear trend.
Our view is that this rally, although now substantial, will almost certainly run out of steam and the bear trend will resume. We expect to see the S&P’s OB/OS fall below -25% and remain there for some time. While the OB/OS is below the buy line the index must be falling. It is only when it breaks up through that buy line that a buy signal is given.
DISCLAIMER
All information and data contained within the PDSnet Articles is for informational purposes only. PDSnet makes no representations as to the accuracy, completeness, suitability, or validity, of any information, and shall not be liable for any errors, omissions, or any losses, injuries, or damages arising from its display or use. Information in the PDSnet Articles are based on the author’s opinion and experience and should not be considered professional financial investment advice. The ideas and strategies should never be used without first assessing your own personal and financial situation, or without consulting a financial professional. Thoughts and opinions will also change from time to time as more information is accumulated. PDSnet reserves the right to delete any comment or opinion for any reason.
Share this article: