Upside Target
4 December 2016 By PDSNETA general feature of the capitalist system is that economies grow. Consumers and businesses are always striving to improve their financial situation by whatever legal (and sometimes illegal) means that they can. It is also true that, in the end, the stock market must always follow the growth of the economy because it constantly discounts the profits of the largest listed companies. Thus the stock market also always trends upwards over the long-term.
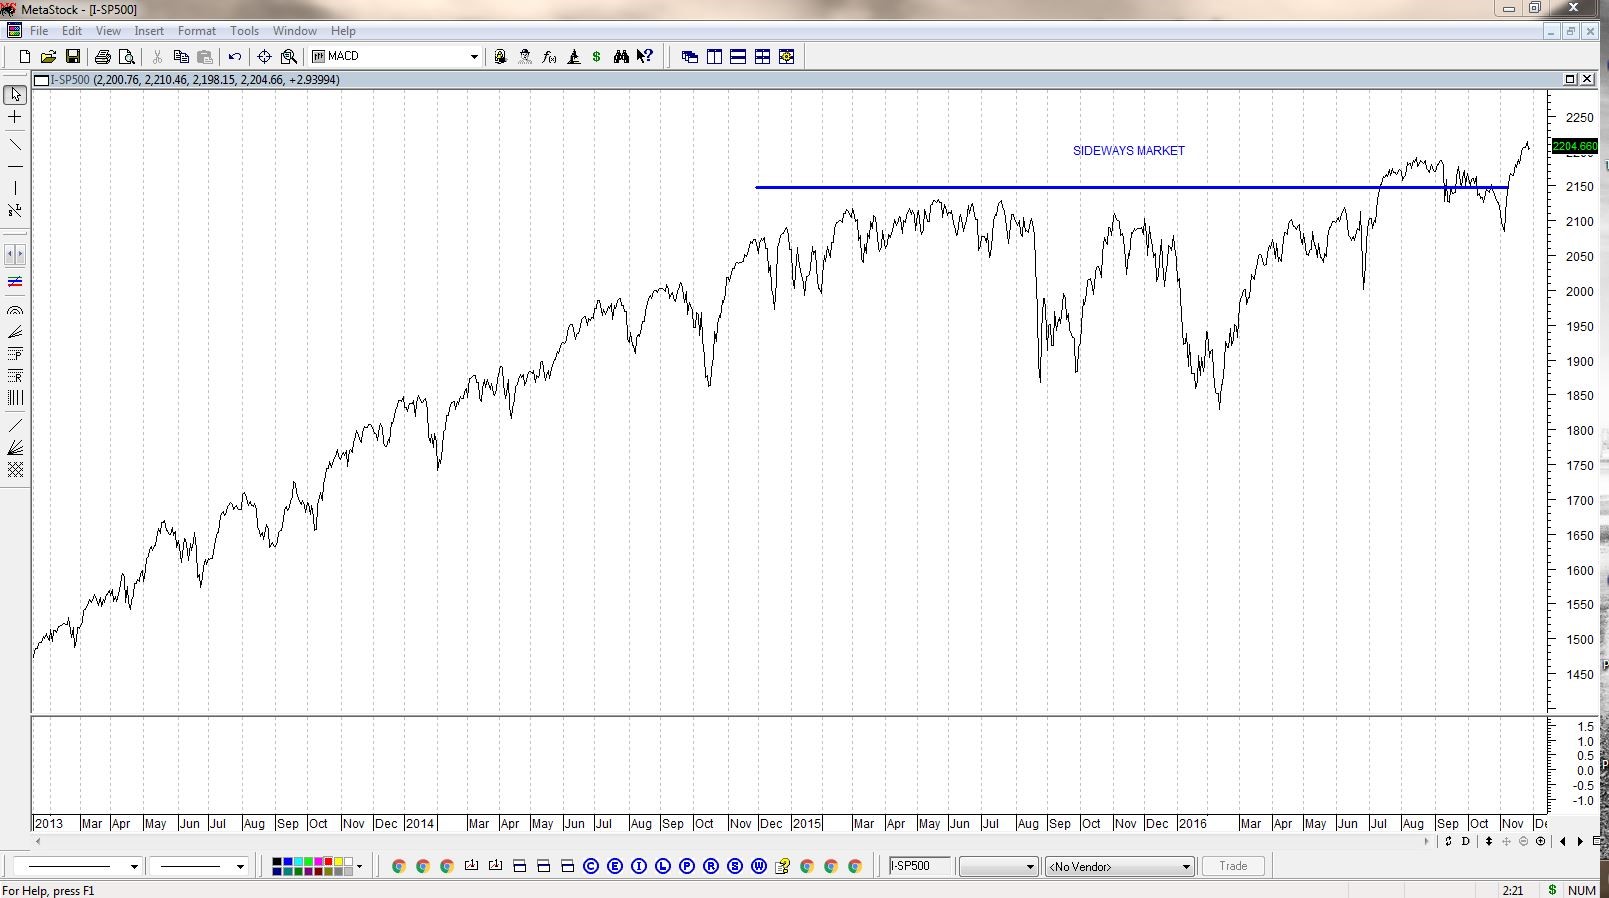
Sometimes, the market enters an extended period of sideways movement where it oscillates up and down, usually between an upper resistance level and a lower support level. Because of the inherent tendency of the economy to grow over time, a long sideways movement usually means that there is a build-up of growth which is not reflected in share prices. Sooner or later, however, there must be an upward move to reflect this growth - and the longer the period of sideways movement, the larger and stronger that upward move will be.
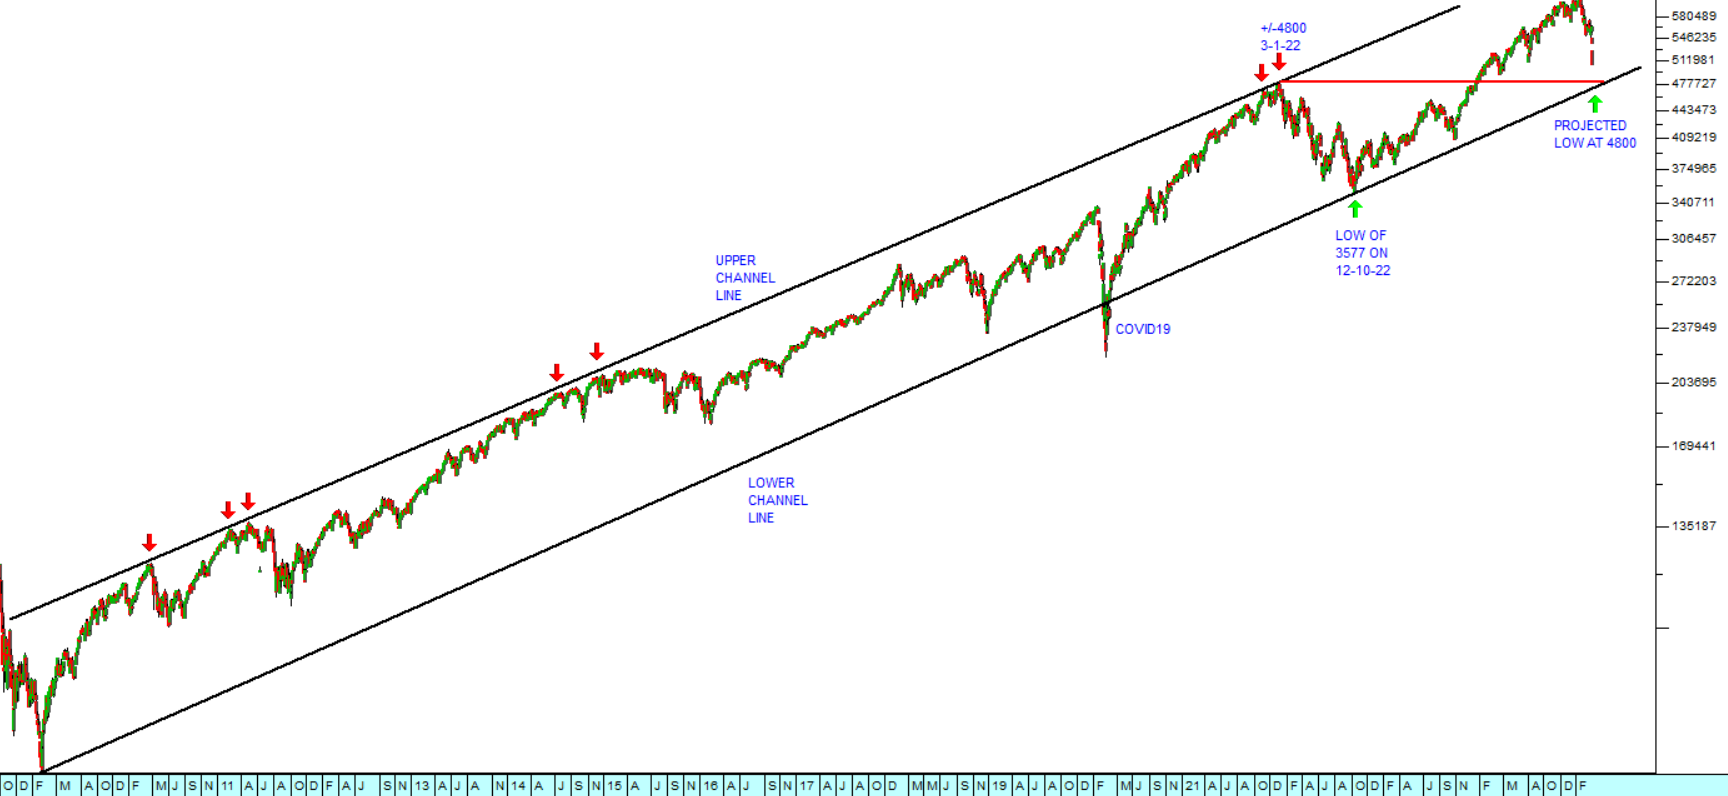
From the chart below you can see that the S&P500 index of the largest companies trading on Wall Street has just ended a protracted period of sideways movement which had been going on for almost two years - since November 2014:
There is a method in point and figure (P&F) charting which you can use to determine roughly how far up the move is going go - once the "consolidation phase" like this ends with an upside break out. It is known as the "Horizontal Count" method. P&F charting is one of the oldest methods of charting in technical analysis and it has generally fallen out of favour in recent years.
P&F charts are one-dimensional in that they do not really measure time - only changes in direction. The logic of that is that investors only really make money when the direction of the trend changes.
Now let us continue with our discussion of the S&P500 index and the application of the horizontal count method to the extended sideways market there.
The chart below shows a point and figure chart of the S&P500 index over the time same period as the line chart given above.
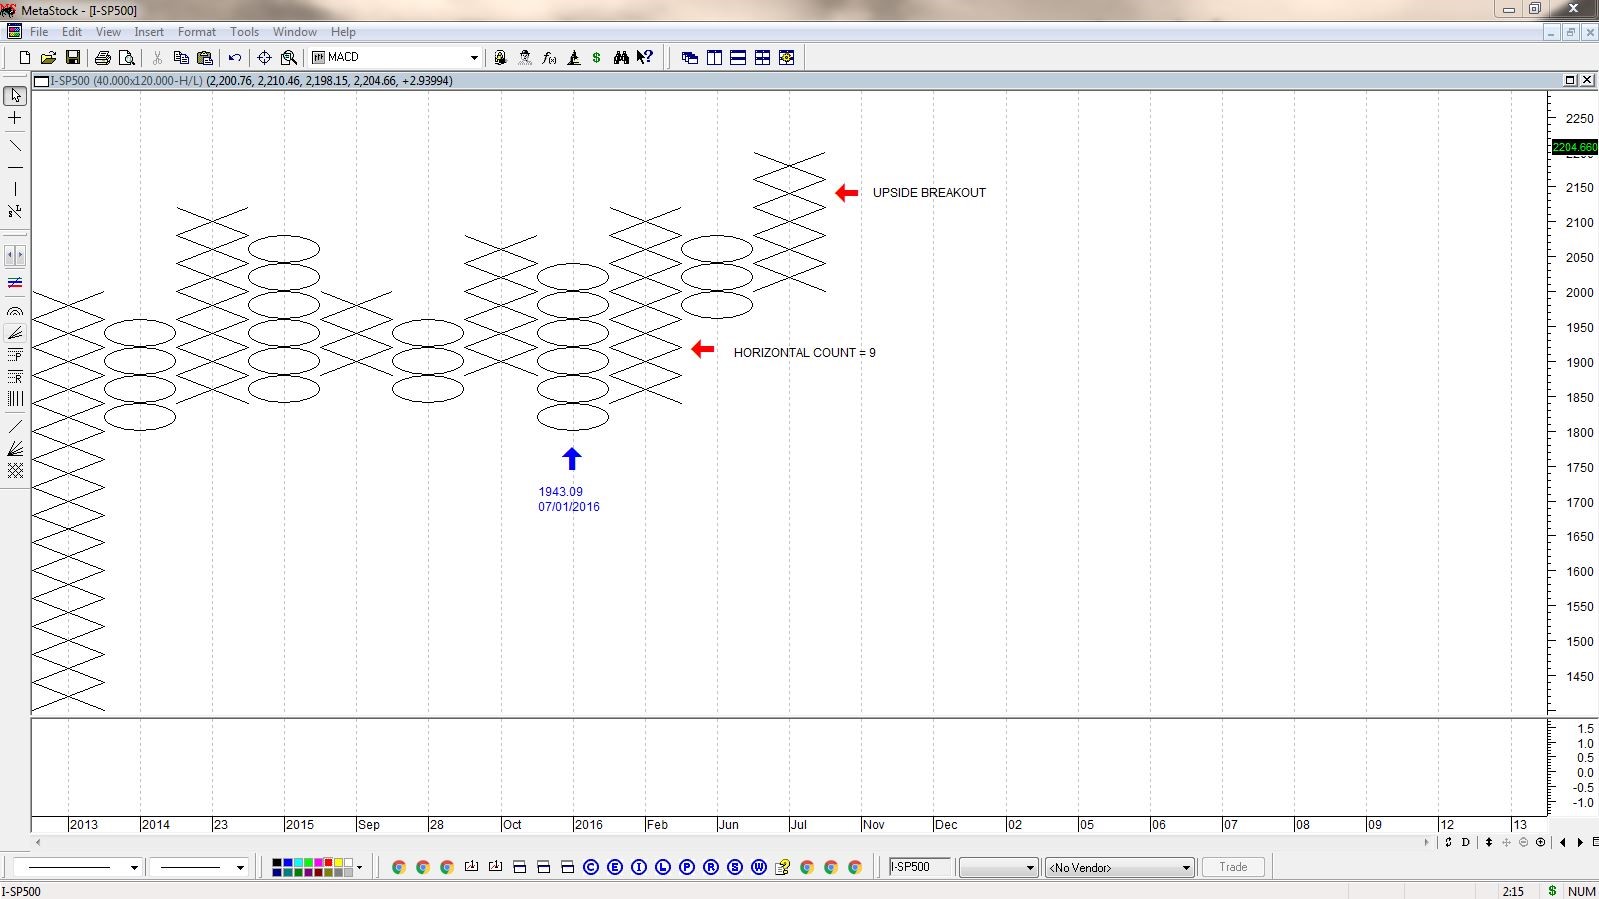
You will note that the rising market which is shown before the start of the sideways market (which began in November 2014) is depicted simply as a single column of "X's" on the extreme left-hand side of the chart. The subsequent sideways market then shows how the S&P entered a period of "backing and filling" (columns of alternating "X's" and "O's") which lasted until a few weeks ago - when there was a clear upside break out.
If you count the number of boxes in an unbroken horizontal line on the chart, you will see that there are nine, in an unbroken row. To get the upside target, this "horizontal count" is multiplied by the box size used in this chart (which was 40 index points) and the reversal (which was 3). The result (9 X 40 X 3 = 1080) is then added to the lowest point on in the sideways period (which was 1947) and that gives you an upside target of 3027 for the S&P.
So the extended horizontal movement portends a 38% rise in the S&P500.
Given that all stock markets around the world follow what happens on Wall Street, this implies that the JSE should also grow by 38% - or probably more since it is a more volatile and usually moves further and faster than Wall Street.
The only problem is that the horizontal count method offers no indication of how long it could take to reach this target - it could be months or years (most likely the latter).
In our experience, the horizontal count method in P&F charting is approximately 70% accurate.
DISCLAIMER
All information and data contained within the PDSnet Articles is for informational purposes only. PDSnet makes no representations as to the accuracy, completeness, suitability, or validity, of any information, and shall not be liable for any errors, omissions, or any losses, injuries, or damages arising from its display or use. Information in the PDSnet Articles are based on the author’s opinion and experience and should not be considered professional financial investment advice. The ideas and strategies should never be used without first assessing your own personal and financial situation, or without consulting a financial professional. Thoughts and opinions will also change from time to time as more information is accumulated. PDSnet reserves the right to delete any comment or opinion for any reason.
Share this article: