Market View
J200 101,977.00 +0.65% J203 110,355.00 +0.79% J210 104,773.00 +0.51% J211 130,490.00 +0.45% J212 26,057.00 +1.12% J213 143,498.00 +0.74%
Winning Shares (Top 5)
Code Name Added Price Latest % Gain % Gain/Year
AEL ALTRON-A 2026-04-15 2199 2856 +29.88% +126.80%
MTH MOTUS 2025-08-27 10360 11209 +8.19% +9.44%
BLU BLUETEL 2025-01-23 610 783 +28.36% +19.42%
SCD SEREIT 2026-07-01 1486 1486 +0.00% +0.00%
CPP COLLINS 2024-05-23 840 1100 +30.95% +14.52%
Opinions (Top 5)
Code Name Date Action
OAO OANDO 2026-07-12 View

Oando (OAO) is an oil and gas company located primarily in Nigeria. It has listings on both the JSE and the Nigerian stock exchange. The problem with a share like this from a private investor's perspective is that it is highly risky. Firstly, it is a commodity share whose fortunes are determined by the international price of oil.

Secondly, its business is located in Nigeria which tends to be politically unstable. Oando's shares are also very thinly traded. In its results for the year to 31st December 2025 the company reported revenue of 3,18bn Niara compared with N4bn in the previous year. Headline earnings per share (HEPS) came in at 2c compared with a loss of 3c in the previous period.

In the year to 31st December 2024, the auditors reported a material uncertainty about its ability to continue as a going concern. The share seldom trades, with less than R1000 worth of shares changing hands each day on average. It is not practical for private investors.

HYP HYPROP 2026-07-12 View

Hyprop (HYP) is a leading property real estate investment trust (REIT) that specialises in high-quality shopping malls in South Africa and some interests in Eastern Europe and Africa to the North. It owns some of South Africa's best-known shopping malls like Rosebank, Canal Walk, Hyde Park, and Clearwater.

It has been impacted to some extent by the fall-off in consumer spending through lower trading densities. This share is currently trading at close to half of its net asset value (NAV) of R63.39 - which in our view makes it a good buy. The new CEO, Morne Wilken, is intent on building roof-top gardens and offering shared workspaces to lure customers back to its shopping malls.

In its results for the six months to 31st December 2025 the company reported net income up 17,5% and headline earnings per share (HEPS) up 44%. The loan-to-value (LTV) was 31%. The company said, "We are confident in the outlook for our portfolios in South Africa and Eastern Europe, supported by strong organic growth opportunities such as the Somerset Mall Phase 3 expansion and the extensions at the Croatia centres, all of which are earnings-enhancing".

In a pre-close update for the five months to 31st May 2026 the company reported tenant turnover up 5,5% and trading density up 4,4%. The company said, "Significant progress was made in our solar-PV rollout, with The Glen's Phase-2 installation (3 205 kWp) completed in June 2026 and CapeGate's 4 991 kWp project on track for completion in August 2026.

At Hyde Park Corner, our solar-PV (946 kWp) and battery energy storage system (BESS) (6 MWh) installation will be completed in July 2026, supporting uninterrupted operations and cost efficiency". Technically, the share found support at 2562c in November 2023 and has been rising ever since.

Hyprop is still trading at below its NAV and on a P:E of 16,42. We still see it as a potential buying opportunity. We added it to the Winning Shares List (WSL) on 15th August 2024 at 3439c per share. It has since moved up to a high of 6440c (27-2-26). It has fallen back on the war in Iran but we believe it will continue to perform.

On 8th July 2026 the company announced that it had raised R739m through the sale of 12,63m new shares. The dilution caused the share price to drop.

HDC HUDACO 2026-07-04 View

Hudaco (HDC) is an importer and supplier of "...automotive, industrial and consumer products" mostly in Southern Africa. Its business has two sides (1) supplying automotive security, power tools, communications, and business supply products to the consumer market and (2) supplying mainly the mining and manufacturing industries with mechanical and electrical power transmissions, diesel engines, hydraulics and pneumatics, steel and thermoplastics, and fittings and bearings." The company has a very well-established business with 26 warehouses, 800 international suppliers and 140 branches.

Through this network they supply about 230 000 products. The company has been battling to export goods because of inefficiencies at South African ports, especially Durban. The group constantly makes bolt-on acquisitions to build and enhance its business. In its results for the six months to 31st May 2026 the company reported revenue up 9,5% and headline earnings per share (HEPS) down 32,9%.

The company said, "The cash outflow from discontinued operations was R24 million. This means that these hitherto loss-making operations will neither be a drag on group performance any longer nor absorb important management attention". Hudaco is an extremely well-managed company operating in a difficult economy.

As the economy improves, Hudaco's results will benefit directly. In our view, this share should be bought on weakness and offers solid, long-term investment potential as the South African economy improves. On 3rd June 2025 Hudaco announced the acquisition of Flosolve's trading assets and liabilities for R45m immediately and maximum of R125m depending on profitability over the next 3 years.

This is a typical "bolt-on" acquisition which will add to Hudaco's existing markets and product range. We see the share as good value at the current price.

OPA OPTASIA 2026-07-04 View

Optasia (OPA) describes itself as, "...a global leader in AI-powered fintech". The company supplies airtime credit solutions and micro financing solutions. It listed on the JSE on 4th November 2025 with 1,16bn shares at 2000c per share. It has subsequently issued a further 68,4m shares.

In its results for the year to 31st December 2025 the company reported revenue up 76% and headline earnings per share (HEPS) up 9%. The company said, "Adjusted Free Cash Flow increased 41% to $44.9 million (2024: $31.8 million), with adjusted Free Cash Flow conversion of 39.2% (2024: 42.4%).

Take Rate increased to 4.8% (2024: 4.0%)". In a trading update for the six months to 30th June 2026 the company reported revenue growth of between 50% and 60% with net income growth of between 30% and 40%. The company said, "Performance during the period was underpinned by robust growth across a number of markets, including Ghana, Pakistan, Indonesia and Congo-Brazzaville, which helped offset the impact of the temporary ACS disruption in Nigeria". It is still a bit early for any technical analysis, but the share appears to have reached a low point of 1362c on 25th June 2026 and now to be entering a new upward trend.

This is a reaction to its latest results. Obviously AI and fintech are areas of strong growth, both internationally and locally at the moment. We expect this share to perform. On 26th March 2026 the company reported that FNB had bought the 6% of its issued share capital previously owned by Zoey Enterprises.

ABG ABSAGROUP 2026-07-01 View

ABSA (ABG) is one of the largest banking groups operating in Africa. It has well-established branches in 12 African countries and representative offices in at least 6 more. It offers a range of products for personal and business banking, credit cards, insurance, and asset management.

Obviously, as one of the "big five" banks, ABSA has been impacted by the recession in South Africa and the generally low consumer spending in the economy. The company announced a joint venture with Patrice Motsepe's African Rainbow Energy to launch a R6,5bn renewable energy fund.

ABSA is certainly a blue-chip share and is worthy of your attention. The separation from Barclays is now complete. On 31st March 2023 the company announced a BBBEE transaction that will take its Black ownership to more than 25%. In its results for the year to 31st December 2025 the company reported headline earnings per share (HEPS) up 12,2% and return on equity of 15%.

Total income increased 5,2% and net asset value (NAV) was up by 7,7% to 19311c per share. In a trading update for the six months to 30th June 2026 the company anticipated that both revenue and operating expenses would increase by middle single digits HEPS to grow by middle to high single digits.

The company said, "The stronger Rand will reduce Group revenue, costs and headline earnings slightly during 1H26". Technically, the share made a low in March 2020 and then moved sideways for the next six months before beginning a new upward trend which is ongoing. We are generally very positive about the potential of banking shares on the JSE.

On a P:E of 7,63 and a dividend yield (DY) of 5,74, ABSA still looks cheap to us. The war in Iran has negatively impacted all banking shares, but this has proved to be temporary.

Winning Share: CPP
Opinion: OPA
Japanese Candlesticks  (2026-07-06)

Long before the Western World had even understood that the study of charts might be beneficial, the Japanese were constructing and studying rice futures charts in a system which today we call candlestick charting. Before candlesticks charts, everyone was using bar charts but today you hardly ever…

Long before the Western World had even understood that the study of charts might be beneficial, the Japanese were constructing and studying rice futures charts in a system which today we call candlestick charting. Before candlesticks charts, everyone was using bar charts but today you hardly ever see a bar chart.

What most investors do not know is that there are literally hundreds of candlestick formations each of which have been extensively analysed and have their own particular interpretations. If you are interested in this, you should get hold of a copy of Japanese Candlestick Charting Techniques: A Contemporary Guide to the Ancient Investment Techniques of the Far East, (1991). The author of the book is Steve Nison.

In candlestick charting, each day’s trade is regarded as a battle between the bulls and the bears which is visible in the opening, highest, lowest and closing prices. So, the body of the candle connects the opening and closing prices. A red body shows that the share closed below the open and a green candle shows that the close was above the open. The shadows (i.e. the lines above and below the body) connect the highest and lowest prices that the share reached during the day’s trade.

Candlestick charting features many different types of candles which can help you to see which way the market is moving.

One of the less common ones is a doji star. This is a candle with a very thin body – in other words where the opening and closing prices are very close – but very long upper and lower shadows – which shows that during the trading day, sentiment swung heavily from being very positive to being very negative – but ended up almost unchanged on the day. Consider the example of a doji star below:

Doji Star formation.

Doji stars usually occur at the top or bottom of a trend and are indication that the direction of the trend is about to change.  

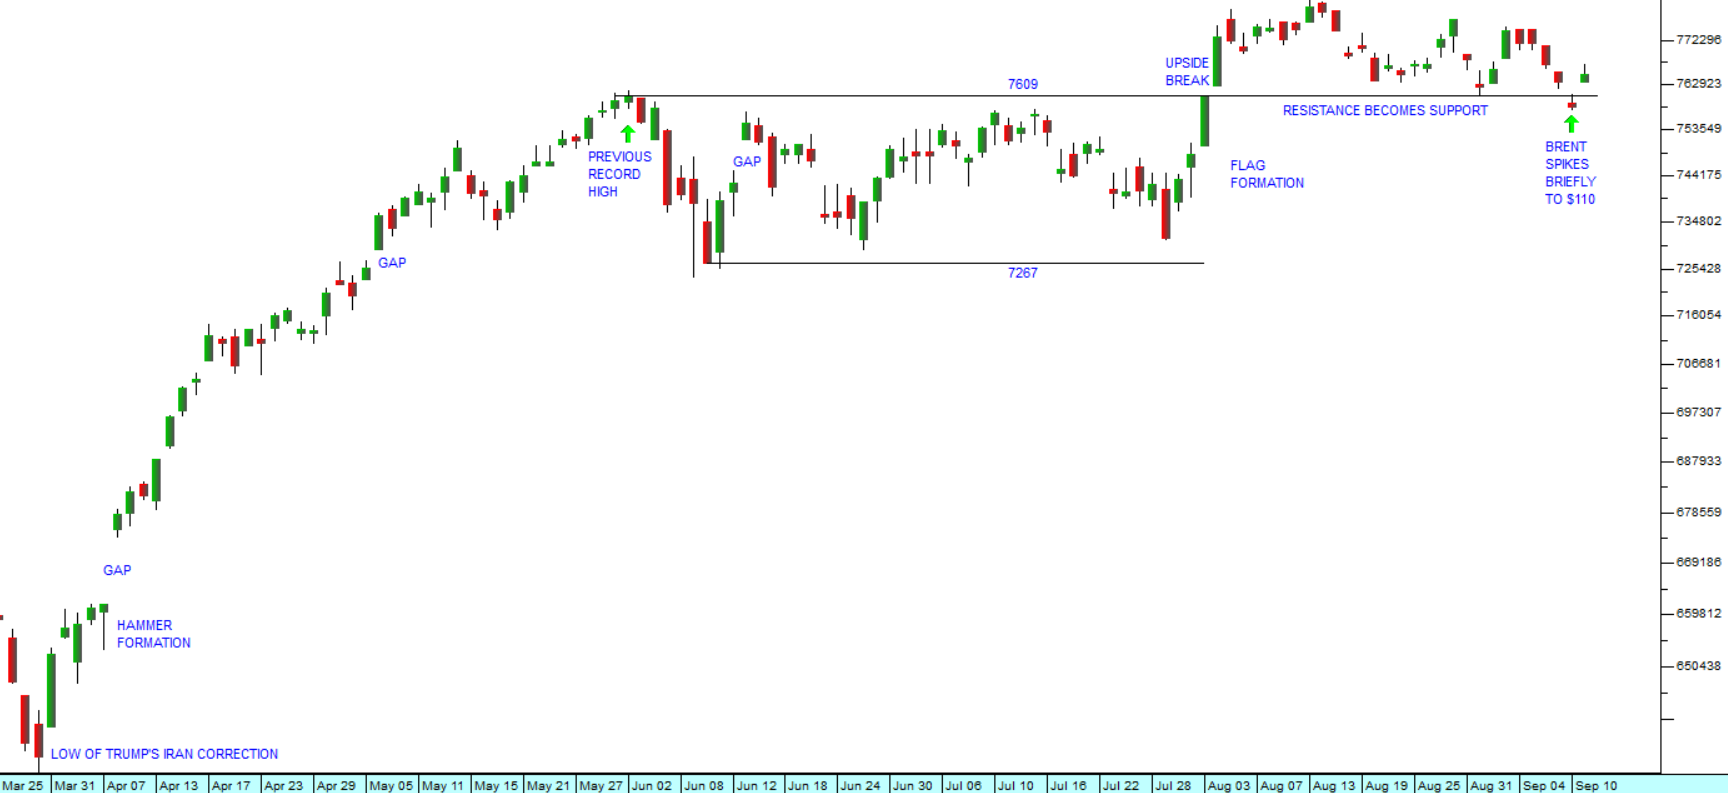
Since the S&P500 reached its all-time high on 2nd June 2026 (at 7609.78), it has been in a triangle formation. Triangles are usually associated with periods of uncertainty, where the level of uncertainty diminishes until the market decides the future direction of the trend by breaking the upper or lower trend lines decisively. The chart below begins with the low point of Trump’s Iran war correction on the 30th of March 2026.   

S&P500 Index : 25th of March 2026 - 30th of June 2026. Chart by ShareFriend Pro.

Shortly after it started going up, the index had a clear hammer formation followed by a gap. The hammer is a very bullish formation which shows that in the battle between the bulls and bears on that day, the bears tried hard to pull the index down, but ultimately could not succeed and it ended slightly up on the day, with the bulls in the ascendancy. The gap which followed that on the next day shows the extent of the bullish sentiment. Then there was a smaller gap in May before the record high was reached.

You will notice that the index has been oscillating since then but that each oscillation has been smaller than the previous one, giving rise to a triangle formation. Last Thursday there was a clear doji star formation. We expect that the index will break up out of the triangle in the next few days.

MTN  (2026-06-22)

Private investors should prefer to invest in service industry companies, especially those which derive a large proportion of their income from passive or annuity income. Such a companies typically require minimal working capital and are not burdened by a large unionised unskilled or semi-skilled…

Private investors should prefer to invest in service industry companies, especially those which derive a large proportion of their income from passive or annuity income. Such a companies typically require minimal working capital and are not burdened by a large unionised unskilled or semi-skilled labour-force.

If most of a company’s revenue comes from regular monthly payments (such as debit orders) then it will typically be profitable even before opening its doors each month. This contrasts sharply with most companies in manufacturing or retail which begin each month from zero and only reach profitability on the 24th or 25th. MTN is a service company which receives a very large proportion of its income from its existing client base in the form of regular payments.    

The company describes itself as a pan-African mobile operator whose purpose is "Leading digital solutions for Africa's progress". Most of its growth these days comes from its data and fintech offerings. It is an interesting company because its largest market is Nigeria and South Africa is only its third largest market. It also has strong markets in Ghana, Uganda and Rwanda.

It has shown itself to be very capable of dealing with Africa’s disparate and politically unstable administrations. This can be seen from its ability to take out large chunks of its profits from various countries. Thus, in the first three months of 2026 it “upstreamed” R2.3bn and generated a healthy corporate liquidity headroom of R42.6bn. After the end of the quarter, R2.7bn of cash was brought in from Nigeria and R5.3bn from Ghana.

In the first quarter of 2026, the company increased its subscriber base by 5,4% to 312,7m and the number of active data users increased by 8,7% to 175,6m. Data traffic was up 20,2% from the same quarter in 2025.

Fintech transactions were up 15,8% and the value of fintech transactions rose by 32,8%. Overall service revenue rose by 41,7% in Nigeria, 35,7% in Ghana, 14,4% in Cameroon and 18,3% in Cote D’Ivoire. All of this compares with South Africa’s paltry 0,7% increase in service revenue. The provision of data is by far the company’s largest contributor to service revenue growth and was up 34,5%.  

From this you can see that while South Africa is an important part of their business, the lion’s share of the growth is coming from elsewhere in Africa. This makes the company a higher risk, higher return investment than other mobile operators but gives it enormous blue sky potential.

In the year to 31st December 2025 the company reported service revenue up 22,9% and data revenue up 37,7%. Headline earnings per share (HEPS) rose by a massive 67% with total customers rising 5,6% to 307,2m. MTN is growing rapidly in line with the growth of the African continent.

The share has also demonstrated its virtual immunity to the war in Iran and the subsequent rise in the cost of energy world-wide. It continues to grow rapidly even though most countries are raising interest rates and tightening their fiscal belts.

Consider the chart:

MTN (MTN) : February 2022 - 19th of June 2026. Chart by ShareFriend Pro.

The chart shows that MTN is in the process of recovering from a major downward trend which began in February 2022 when the war in Ukraine began. From a technical perspective the company completed an almost perfect reverse head-and-shoulders formation during 2024, finally breaking up through the neckline in mid-January 2025. Added to the Winning Shares List (WSL) on 15th January 2025 at a price of 9729c, it has subsequently risen to 23068c – a gain of 133,47% in 17 months. It also paid out a R5 dividend to shareholders for the 2025 year.

In our view, the spread of digital solutions in Africa is making the various African countries more reliable both politically and economically. They are no longer backwaters of progress and knowledge, but are able to share in the massive explosion of information that is sweeping the world. Africa has enormous resources of metals and minerals as well as proven agricultural potential. It is steadily catching up with the rest of the world economically and MTN is participating in that growth.  

The Collapse of Bitcoin  (2026-06-15)

We have never liked Bitcoin or even regarded it as a true investment. As Charlie Munger famously said about those who buy cryptocurrencies, “...somebody else is trading turds and you decide I can't be left out.” More recently, the esteemed Professor Paul Krugman has linked the price of Bitcoin…

We have never liked Bitcoin or even regarded it as a true investment. As Charlie Munger famously said about those who buy cryptocurrencies, “...somebody else is trading turds and you decide I can't be left out.” More recently, the esteemed Professor Paul Krugman has linked the price of Bitcoin directly to the political influence and dominance of Trump. He described its value as nothing but “technobabble”.

We have always advised people not to invest in it and to sell it if they had it. We hope that you took our advice. Our main reason for not considering it to be an investment is that it offers no return. It generates no interest, dividends or rent – meaning it lacks fundamental value. So, its value really only exists in the minds of the people who buy it and as they come to realise their mistake, the price will inevitably decline.

At one point there was the suggestion that cryptocurrencies were somehow digital gold, but nothing could be further from the truth. The truth is that the demand for cryptos is much more similar to the demand for tulips in Holland in the seventeenth century. It exists only in the minds of a relatively few individuals who have been swept away by the rapid advances in technology in the modern world. Cryptos lack universal appeal. By contrast, gold has been known and prized by every human being on earth for millennia no matter what their culture, creed or background.

In any event we will let the chart tell the story.

Bitcoin : April 2025 - 12th of June 2026. Chart by ShareFriend Pro.

The collapse of Bitcoin from its peak in October 2025 has been dramatic. Its value has more than halved through a series of cycles. The cycles are caused by the “stale bulls” who simply refuse to acknowledge that Bitcoin’s popularity is now permanently and irreversibly damaged. The Bitcoin price is falling just as Trump’s popularity and political clout are falling.

The effect of Trump’s ill-advised decision to go to war with Iran and the consequent jump in the price of fuel worldwide can be clearly seen. His popularity has nose-dived. Even hardline MAGA supporters who remained loyal through all his other obvious problems found the jump in the price of “gas” just too much to stomach.

From a technical perspective Bitcoin has broken down through a series of key support levels. Firstly, it found support at $83268 – the cycle low of November 2025 and that was followed by quite a significant “stale bull” rally. The rally came to an end when Bitcoin broke below that support level in February 2026 and then smashed down through the earlier cycle low at $77380 established in April 2025.

When Trump began bombing Iran, a new low point was established on 24th February 2026 at $64 000 and again the stale bulls motivated a rally which took the crypto briefly back above $80 000. However, Trump’s continued unpopularity and the growing evidence that he may be suffering from some kind of dementia has resulted in Bitcoin breaking decisively below $64 000 – which has now become a technical resistance level.   

While we see Wall Street recovering from the current correction, we do not see Bitcoin recovering. As Trump inevitably descends into political oblivion, so too will Bitcoin. Already it is an investment sideshow used primarily by organised crime to move money with impunity.  

From our very first article on Bitcoin in December 2017, The Bitcoin Bubble, we have always advised investors to stay away from it. Our advice remains unchanged:

“If you have it, sell it. If you don’t have it, don’t buy it”.

JSE Top 40

101,977.00 (+0.65%)

All Share

110,355.00 (+0.79%)

Financial 15

26,057.00 (+1.12%)

J200
J203
J212
Top Gainers
# Code Name Close (c) % move
1 SEB SEBATA 90 +8.43%
2 RNG RANGOLD 283 +8.43%
3 SAP SAPPI 1114 +7.84%
Top Losers
# Code Name Close (c) % move
1 RMH RMBH 49 -12.50%
2 DLT DELPROP 44 -8.33%
3 GML GEMFIELDS 64 -5.88%

Top Movers – Charts

Top Gainer: SEB
Top Loser: RMH