Market View
J200 105,735.00 +1.06% J203 113,302.00 +1.05% J210 122,624.00 +3.31% J211 135,884.00 +0.16% J212 23,895.00 -0.18% J213 140,255.00 -0.02%
Winning Shares (Top 5)
Code Name Added Price Latest % Gain % Gain/Year
SUR SPURCORP 2023-08-08 2488 3720 +49.52% +21.09%
ADH ADVTECH 2023-08-14 1975 3652 +84.91% +36.42%
CGR CALGRO-M3 2023-08-15 356 481 +35.11% +15.08%
CAA CA-SALES 2023-08-25 775 1520 +96.13% +41.77%
CPI CAPITEC 2023-11-04 185496 398773 +114.98% +54.57%
Opinions (Top 5)
Code Name Date Action
SAC SA-CORP 2025-12-15 View

SA Corp (SAC) owns a group of 199 industrial, retail, storage, residential and office properties in South Africa plus a 50% stake in a joint venture in Zambia with 3 properties. The bulk of this portfolio is in retail (43%) and industrial (28%). The company has problems across its portfolio, and especially in its office and industrial properties where it has been experiencing negative rental reversions.

Obviously, it is exposed to the poor economic conditions facing South Africa at the moment. Various offers have been made to buy out the company which have been rejected by the board. The new (and returning) CEO, Rory Mackey, plans to turn the company around over the next year - by getting it out of the office market and concentrating on residential and retail portfolio.

On 15th March 2023 the company announced that it had made a firm offer to acquire the entire issued share capital of Indluplace (ILU) for R3.40 per share which would result in the delisting of that company. On 18th July 2023 the Indluplace announced that the deal had been approved and so we expect ILU to be delisted in due course.

In its results for the six months to 30th June 2025 the company reported headline earnings per share (HEPS) of 13,33c compared with 14,34c in the previous period. The company's loan-to-value (LTV) was 40,3% and the distribution per share rose by 7,5%. In a pre-close update on 12th December 2025 the company reported loan-to-value (LTV) on 30th November 2025 at 38,6% and dividends per share (DPS) of between 4% and 5% above 2024.

Technically, the share is in an upward trend and should continue to perform well. 

SLG SALUNGANO 2025-12-15 View

Salungano, previously Wescoal, engages in the mining and trading of coal. The company began production in 2021 producing coal from its Moabsvelden mine for Eskom. Today the company produces 300m tons from five coal mines. Mining accounts for 82% of revenue, but it owns 50% of the Arnot Mine and is looking to broaden its business into other parts of energy.

In its financials for the six months to 30th September 2024 the company reported revenue of R2,18bn and headline earnings per share (HEPS) of 21,56c compared with a loss of 90c in the previous period. The company's net asset value (NAV) fell to 23c per share from 37c. The share remains suspended due to the late publication of financials.

Clearly this is not suitable for private investors. 

KAP KAP 2025-12-11 View

KAP International Holdings (KAP) is a diversified industrial company which produces and markets timber, chemicals (PET and related chemicals), bedding and car parts. It also has a logistics division. The acquisitions of Safripol and Hosaf were integrated into a polymers business under the Safripol name.

The bedding division showed strong growth with new investment in infrastructure and manufacturing capability. Growth in the automotive parts division was muted. This company was 43% owned by Steinhoff - which has now divested completely. The renewal of the government's Automotive Production and Development Programme (APDP) until 2035 will be a boost for KAP's parts manufacturing business.

The timber division is ramping up after the lockdown and demand for its products has remained buoyant. The automotive components division was severely impacted, and the post-lockdown recommencement has been slow. The bedding division was able to operate through the lockdown with strong demand for medical and agricultural needs.

Polymers also operated throughout the lockdown. In a report on 20th April 2022 into the flooding in Natal the company said, "The Company’s operations in the region have experienced some temporary operational and supply chain disruptions, which are in the process of being resolved." In its results for the year to 30th June 2025 the company reported revenue up 2% and headline earnings per share (HEPS) down 47%.

In an operational update for the five months to 30th November 2025 the company reported, "increased operating costs related to the start-up and ramp-up of PG Bison's new medium-density fibreboard ('MDF') line; higher finance costs, which were capitalised during the construction phase of the group's major capital projects completed during the year ended 30 June 2024 ('FY24'), including the new MDF line; and lower vehicle production by two major original equipment manufacturers ('OEMs'), which mostly resulted in a weaker performance by Feltex".

In an initial trading statement the company estimated that HEPS would increase by more than 20% in the six months to 31st December 2025. Technically, the share has been falling since September 2024 and we recommend waiting for it to break up through its downward trendline before investigating further.

It is currently in an "island formation" which began in June 2025. Obviously, the logistics problems at Transnet have been having an impact. We think it may represent good value at current levels, but it is volatile.

GND GRINDROD 2025-12-11 View

Grindrod (GND) is an international freight and financial services company which operates in twenty-eight countries. In mid-June 2018, Grindrod unbundled and separately listed its loss-making shipping division (Grinship - GSH). This accounts for the "cliff" in the share price at that time.

The company is now focused on its two remaining divisions - freight and financial services. Grindrod owns the North-South railway line from Beitbridge to Victoria Falls as well as port terminals at Richards Bay, Natal, Walvis Bay, Namibia, and Maputo. The company is positive on the growth of its financial services division which is about 30% of the business.

The company is focused on getting its retail banking division involved with small and medium sized businesses. The conflict in northern Mozambique is a problem for this share. The flooding in Natal caused five of their sites to be suspended for several weeks. On 6th November 2024 the company reported that it had closed down all its rail, port and terminal operations in Mozambique because of the closure of the Lebombo border post due to violence on the Mozambique side.

A few days later on 8th November 2024, the company reported that the restrictions at Lebombo had been lifted - but the event showed Grindrod's vulnerability and exposure to unrest in Mozambique. In its results for the six months to 30th June 2025 the company reported revenue down 4% and headline earnings per share (HEPS) up 23%.

The company said, "The first half of 2025 ("the period") was marked by a strong rebound in the second quarter, particularly in the Port and Terminals segment, following a slow start to the year." In an update on the 11 months to 30th November 2025 the company reported the average price for dry-bulk commodities decreased by 12% and their terminals handled 15,2m tons. The company said, "Gross debt as at 30 November 2025 increased to R3.7 billion (2024 December: R2.9 billion), largely due to the sub-concession lease liabilities at the Matola and Maputo terminals offset by debt repayments.

The Group's net cash at 30 November 2025 amounted to R0.2 billion." Technically, the share has been rising since February 2022. It has recently completed a reverse "head-and-shoulders" formation in August 2025 - which is very bullish. We expect the share to continue to perform well despite being volatile.

On 19th June 2025 the company announced that its CEO, Xolani Mbambo, would resign with effect from 31st December 2025.

ABG ABSAGROUP 2025-12-10 View

ABSA (ABG) is one of the largest banking groups operating in Africa. It has well-established branches in 12 African countries and representative offices in at least 6 more. It offers a range of products for personal and business banking, credit cards, insurance, and asset management.

Obviously, as one of the "big five" banks, ABSA has been impacted by the recession in South Africa and the generally low consumer spending in the economy. The company announced a joint venture with Patrice Motsepe's African Rainbow Energy to launch a R6,5bn renewable energy fund.

ABSA is certainly a blue-chip share and is worthy of your attention. The separation from Barclays is now complete. On 31st March 2023 the company announced a BBBEE transaction that will take its Black ownership to more than 25%. In its results for the six months to 30th June 2025 the company reported income up 5,2% and headline earnings per share (HEPS) up 16,5%.

The cost-to-income ratio increased to 53,2% and the net asset value rose by 11,3% to 18014c per share. The company said, " Pre-provision profit increased 4% to R26.4bn. Credit impairment charges declined 14% to R7.2bn, resulting in a 1.00% credit loss ratio from 1.23%." In a trading update for the year to 31st December 2025 the company estimated single digit revenue growth and, "Our credit loss ratio is expected to improve to the upper half of our through-the-cycle target range of 75 to 100 basis points (bps), from 103 bps in 2024, resulting in lower credit impairments." Cost-to-income is expected to be slightly above the 53,2% of 2024 with a return on equity (ROE) of about 15%.

Technically, the share made a low in March 2020 and then moved sideways for the next six months before beginning a new upward trend which is ongoing. We are generally very positive about the potential of banking shares on the JSE. On a P:E of 7,75 and a dividend yield (DY) of 5,62, ABSA still looks cheap to us. 

Winning Share: CAA
Opinion: SAC
The Demise of Bitcoin  (2025-12-15)

Why is the Bitcoin price falling when the price of gold is rising?Cryptocurrency doyens always claim that Cryptos are somehow a hedge against the impending weakness of paper assets – and especially the US dollar. But our observation is that Bitcoin is more of a risk-on asset than a risk-off asset…

Why is the Bitcoin price falling when the price of gold is rising?

Cryptocurrency doyens always claim that Cryptos are somehow a hedge against the impending weakness of paper assets – and especially the US dollar. But our observation is that Bitcoin is more of a risk-on asset than a risk-off asset. When risk-averse investors run for cover, they don’t switch to Bitcoin. Rather they switch out of Bitcoin and into gold.

Cryptocurrencies and gold are the same in that neither one of them offers the investor any kind of income or return. Your Krugerrands and your Bitcoin don’t pay you any interest, rent or dividends. So, neither of them can really be seen as an investment in any true sense. Both owe their value to investor belief and to their relative scarcity.

The difference is that almost everyone throughout the world believes in the value of gold, while only a very small, relatively esoteric, group of passionate protagonists (like Elon Musk) and their followers believe in the value of Bitcoin.

The simple truth is that your Krugerrands can be bought and sold in any country throughout the world. From the humblest coin dealer in the backstreets of Shanghai to the sophisticated halls of London’s Threadneedle Street, one ounce of gold is immediately recognised and highly valued. At the same time, the value of a Bitcoin is volatile and the subject of endless debate. Gold has been sought after and valued for more than five millennia, while Bitcoin has only been around for just over 15 years.

Elon Musk warns that the US government debt is eventually going to result in a collapse of the US dollar and hence a massive increase in the price of cryptos. While we agree that the US dollar is weakening and has been for most of this year, over the long term it has held its value. For example, in April 1990, the US dollar bought you 160 Japanese yen and today it buys you 155,8 yen. In May 2003, one US dollar was worth about 87 euro cents. Today it is trading for 85.40 euro cents.

In 1987 economists and investors were very concerned about the level of debt in America as the US government's borrowing reached $3 trillion and they warned of the imminent collapse of the economy. Today, 38 years later, the US national debt is $38,74 trillion and rising rapidly.  The same experts and fear-mongers are again warning of the economy’s imminent demise.

Certainly, the US budget deficit is a concern, but we do not believe that it portends the collapse of the US economy any time soon. In our view, the US economy is being supported by the massive productivity benefits which are flowing from new technologies and particularly the spread of AI through the economy.

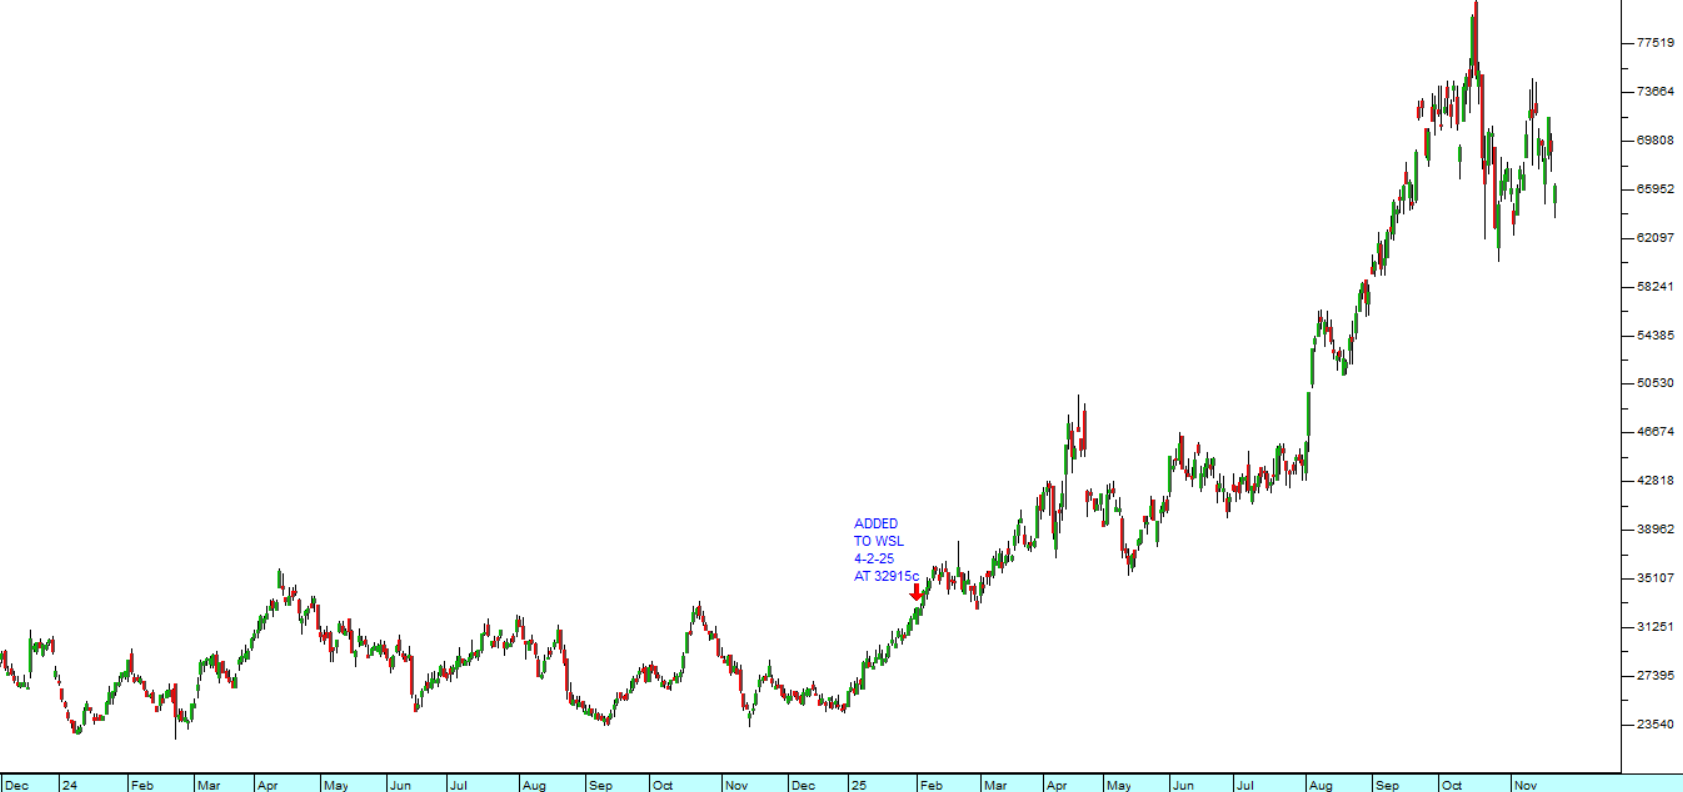
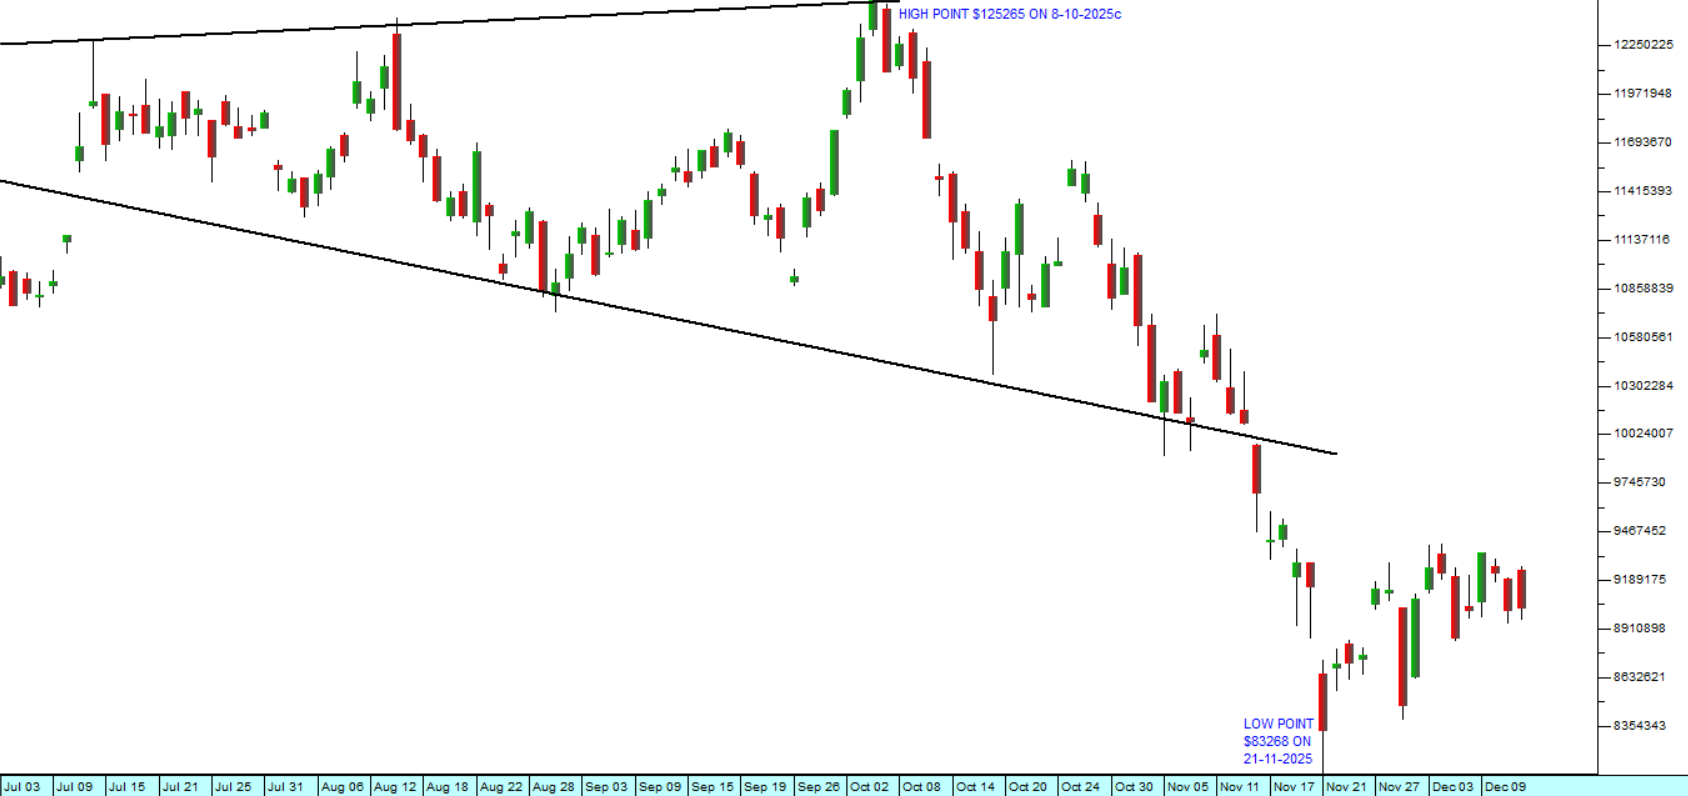
The Bitcoin price has itself collapsed over the last 10 weeks from its peak of $125265 to current levels of around $90 000 and it has been as low as $83268 (21-11-25). That’s a fall of 33,5%. Consider the chart:

Price of Bitcoin in US dollars : 3rd of July 2025 - 12th of December 2025. Chart by ShareFriend Pro.

The Nobel prize-winning economist, Professor Paul Krugman, suggests that the fall of crypto prices is directly linked to fall in Trump’s influence and power in America. He may well be right. There can be little doubt the Trump and MAGA movement have suffered some significant set-backs this year and that the excitement that his return to the White House created for cryptocurrencies has abated. There can also be little doubt that the big players are getting out of Bitcoin or as Krugman puts it, “...the Trump trade is unwinding”.

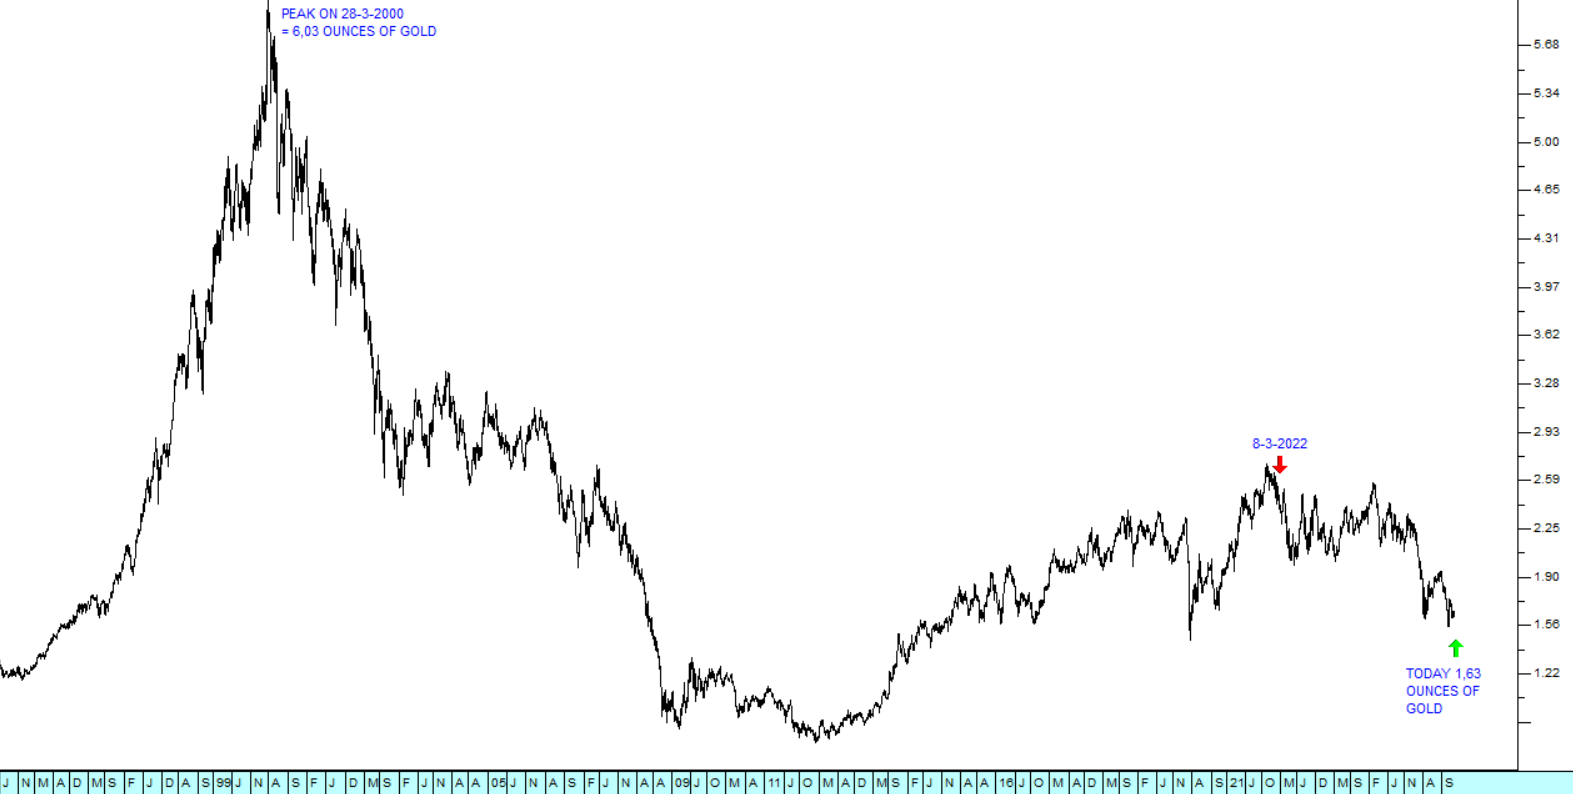
The rapid rise of the gold price since March 2024 definitely indicates that big international investors are worried about the future of paper assets. Why else would they give up the interest which they could earn on government Treasury bills and put their wealth into gold? But perhaps, instead of a collapsing US economy, they are seeing the inevitable inflation which will result from a world economy that is moving into a powerful boom phase, driven by rapidly increasing productivity levels.

Perhaps the only lesson we can learn from all of this is that cryptos are not in any sense a hedge. Rather, they are a rich man’s speculative plaything – to be abandoned whenever belief levels falter. And Musk’s economic opinions are about as reliable and consistent as his political opinions. He is undoubtedly an engineering genius – but that does not automatically make him an expert in social media, politics or economics.


The Collapse of the Dollar  (2025-12-08)

The currency of a country is like the shares of a company. If a company is expected to do well and make profits, then its shares will rise and vice versa. The same is true of a currency. If the country’s economy is expected to do well and create strong growth, then its currency will appreciate…

The currency of a country is like the shares of a company. If a company is expected to do well and make profits, then its shares will rise and vice versa. The same is true of a currency. If the country’s economy is expected to do well and create strong growth, then its currency will appreciate against the currencies of other countries – and vice versa.

The problem is, of course, that because the US dollar (US$) is the dominant world currency, everything gets measured against it, so if the US$ itself is falling rapidly (as it is) then it becomes difficult and misleading to use it as a benchmark currency.

But what else can we use? We need a currency that holds its value through thick and thin - something that will retain its value despite tariff wars, and the various unpredictable exigencies of the modern world economy. There is only one reliable benchmark – gold.

Throughout history, gold has always retained its purchasing power. One ounce of gold today will buy you the same number of cattle or chickens that it would have bought you 5000 years ago in Egypt. The effective purchasing power of gold has never really changed much. Currencies may come and go, get stronger or weaker, but gold is the ultimate asset against which they can and must all be measured.

OIL

For example, we all know that the oil price has been falling. On the 8th of March 2022 one barrel of North Sea Brent oil would have cost you $125.95 and today that same barrel would cost you just $63.76c – a fall of almost 50% - but in US dollars. During the same time period the price of gold in US dollars went from $2056.82 to where it is today - $4214.74. In other words, against the benchmark of gold, the US$ lost 51.2% of its value. This means that the price of Brent oil, in terms of gold, has actually dropped by a whopping 71.7%. This perhaps explains Putin’s true dilemma. In terms of gold the value of Urals crude has almost disappeared completely.

BITCOIN

We can do the same exercise with Bitcoin over the same time period. On the 8th of March 2022, one Bitcoin was trading for $38 697.27 and today, despite its massive fall over the past two months, the same coin is worth $88538.48 – a gain of 128.8%. And the crypto bulls could take some comfort from that – until they adjust for the fall of the US dollar over the same time period. In terms of gold, one Bitcoin was worth 18.80 ounces of gold on the 8th of March 2022 and today it is worth 21 ounces – a gain of just 11.7%.

WALL STREET

And what of the S&P500 index? We all know that Wall Street is in a primary bull trend and has been for 16 years. Beginning again on the 8th of March 2022, we see that the S&P closed on that day at 4170.7 and today it is at 6870.4 – a gain of 64.7%. But if we consider how much it has moved in terms of gold, we find that it is actually down 19.6% over that same time period. Consider the chart:

Comparative relative strength : S&P500 Index/Price of gold in US dollars - July 1996 - 5th of December 2025.

This is a comparative relative strength indicator (CRSI) chart of the S&P500 index divided by the US dollar price of gold. It shows that, in terms of gold, the S&P500 in fact peaked on the 28th of March 2000 at 6.03 ounces of gold - and that today it is trading for just 1.63 ounces – a 73% fall. The chart also shows that from the 8th of March 2022 it has been falling fairly steadily.

This type of analysis paints a very different picture from what we are used to - and one which you may find quite shocking. But of course, when you invest in the share market you buy and sell your shares for rands – and if you are successful, you make a profit in rands. The same applies to investors on Wall Street. Irrespective of what is happening to the value of the US dollar, their profits are still real in terms of the currency that they are using.

What you can learn from this is that gold is the constant. The gold price does not go up and down. Currencies, stock markets, bonds, cryptos and all paper investments go up and down against gold. The real value of gold hardly changes from one millennium to the next.

Since the beginning of this year, the United States dollar (US$) has been falling against the currencies of other countries indicating America’s general decline as the world’s leading economy and super-power. Since the beginning of the year alone, the US dollar has fallen 12.2% against the euro. On the 9th of April this year it took R19.93 to buy one US$. Today you can buy one for R16.96 – which means that the US$ has fallen almost 15% against the rand in just 8 months.

CRSI used in the chart above is a very simple indicator – it is calculated by dividing one data stream by another and then charting the result. You can use the CRSI to chart anything in terms of the gold price or to chart anything in terms of anything. It simply divides one data stream by another and then draws a graph of the result.  

Gold Fields  (2025-11-24)

For the past month, the US dollar price of gold has once again encountered some resistance – this time at around $4000. Despite this, in our view, the gold price is in a strong upward trend which should continue. One of the major factors is the steady decline in the US dollar value against a…

For the past month, the US dollar price of gold has once again encountered some resistance – this time at around $4000. Despite this, in our view, the gold price is in a strong upward trend which should continue. One of the major factors is the steady decline in the US dollar value against a trade-weighted basket of currencies, but the main reason for the upward trend in gold is that large international investors and central banks are looking to put more and more of their funds into safe investments.

As a private investor, you are aware that investing in gold shares can be risky because gold producers are price takers. The price of gold is set on international markets which are outside their control. They can also be riskier because of all the problems associated with deep-level underground mining. But with high risk comes high return and this may make them worthy of your consideration.

Gold Fields (GFI) is an interesting option. Most of its mines are outside of South Africa, with the exception of South Deep – which, the legendary mining magnate, Brett Kebble, once described as “...the world’s most expensive long drop.” South Deep has been pouring money into the development of the mine and their efforts are finally beginning to pay dividends.

South Deep is said to be the world’s second largest known underground reserve of gold, with an estimated life of 80 years at current production levels and more than 32m ounces of reserves. And it is now developed to the point where it is a safe, low-cost, bulk, mechanised and profitable gold mine.

In addition to South Deep, the company is focusing on bringing the new Salares Norte gold mine in Chile into production. This is a high-grade, open pit, gold-silver project in Chile with 3,9m ounces of reserves. On 12th August 2024, the company announced that it had acquired the remaining 50% of Osisko Mining for $1,39bn. Gold Fields also announced the acquisition of Gold Road resources in Australia for $2,4bn.

The mining house is expecting to generate about $20bn in cash flows from its various projects over the next five years out of which it will pay dividends of $6bn in addition to $500m in special dividends and share buy-backs. It is currently benefiting from the high gold price. It expects to produce 3 million ounces of gold per annum by 2030.

Gold Fields recently acquired the remaining 50% of Osisko to give it 100% of the Windfall project in Canada. Windfall is one of the top ten largest gold deposits in the world and Gold Field plans to spend $1,7bn bringing it into production over the next five years.

Gold Fields shares were moving sideways during 2024, but began a new upward trend in January 2025. Consider the chart:

Gold Fields  (GFI) : December 2023 - 21st of November 2025. Chart by ShareFriend Pro.

With the stronger gold price and the upside break out of its sideways pattern, we decided to add Gold Fields to the Winning Shares List (WSL) on 4th February 2025 at a price of 32915c. It has subsequently risen as high as 78955c (16-10-25) and is currently trading for 66431c. This means that it has more than doubled in price over the past 10 months.

We expect it to continue performing well as central banks world-wide move away from US Treasury bills and further into gold bullion. It is obviously a risky commodity share and highly dependent on the gold price, but it is currently in a correction so you would not be buying it at the top of its cycle. If gold climbs out of its current sideways pattern, you can expect GFI to rise sharply. It is a diversified international mining house with some really excellent long-term prospects and great management.   

[BD20 – page 11 – Article about Goldfields]

Follow-up

In our article, Bubble which we published about a month ago on 27th October 2025, we suggested that there was potentially an over investment in AI shares. We warned investors to take care and to maintain a strict stop-loss strategy. Since then, the S&P has entered a correction which looks much stronger than the various mini-corrections which have characterised the last six months. From a technical perspective, the S&P now has a descending double top and on the 20th of November 2025 it closed below its previous cycle low made on 10th November 2025 at 6552. This is not a good sign, and it may well cause substantial technical selling this week. Consider the chart:

S&P500 Index : 4th of September 2025 - 21st of November 2025. Chart by ShareFriend Pro.

So be aware – we seem to be in for a significant correction which will not easily be derailed by bulls buying the dips.

JSE Top 40

105,735.00 (+1.06%)

All Share

113,302.00 (+1.05%)

Financial 15

23,895.00 (-0.18%)

J200
J203
J212
Top Gainers
# Code Name Close (c) % move
1 PPR PUTPROP 475 +35.71%
2 OAO OANDO 20 +33.33%
3 MDI MASTDRILL 1724 +10.16%
Top Losers
# Code Name Close (c) % move
1 ACT AFRO-C 117 -13.97%
2 HLM HULAMIN 200 -13.04%
3 TMT TREMATON 104 -12.61%

Top Movers – Charts

Top Gainer: PPR
Top Loser: ACT