Correction
12 August 2024 By PDSNETOn the 10th of July 2024, we tweeted (on “X”) that “...some sort of correction is looking more and more likely.” Four trading days later on the 16th of July 2024, The S&P500 index reached its highest point (5667.2) and began that correction. So far, the S&P has fallen 8,5%. Consider the chart:
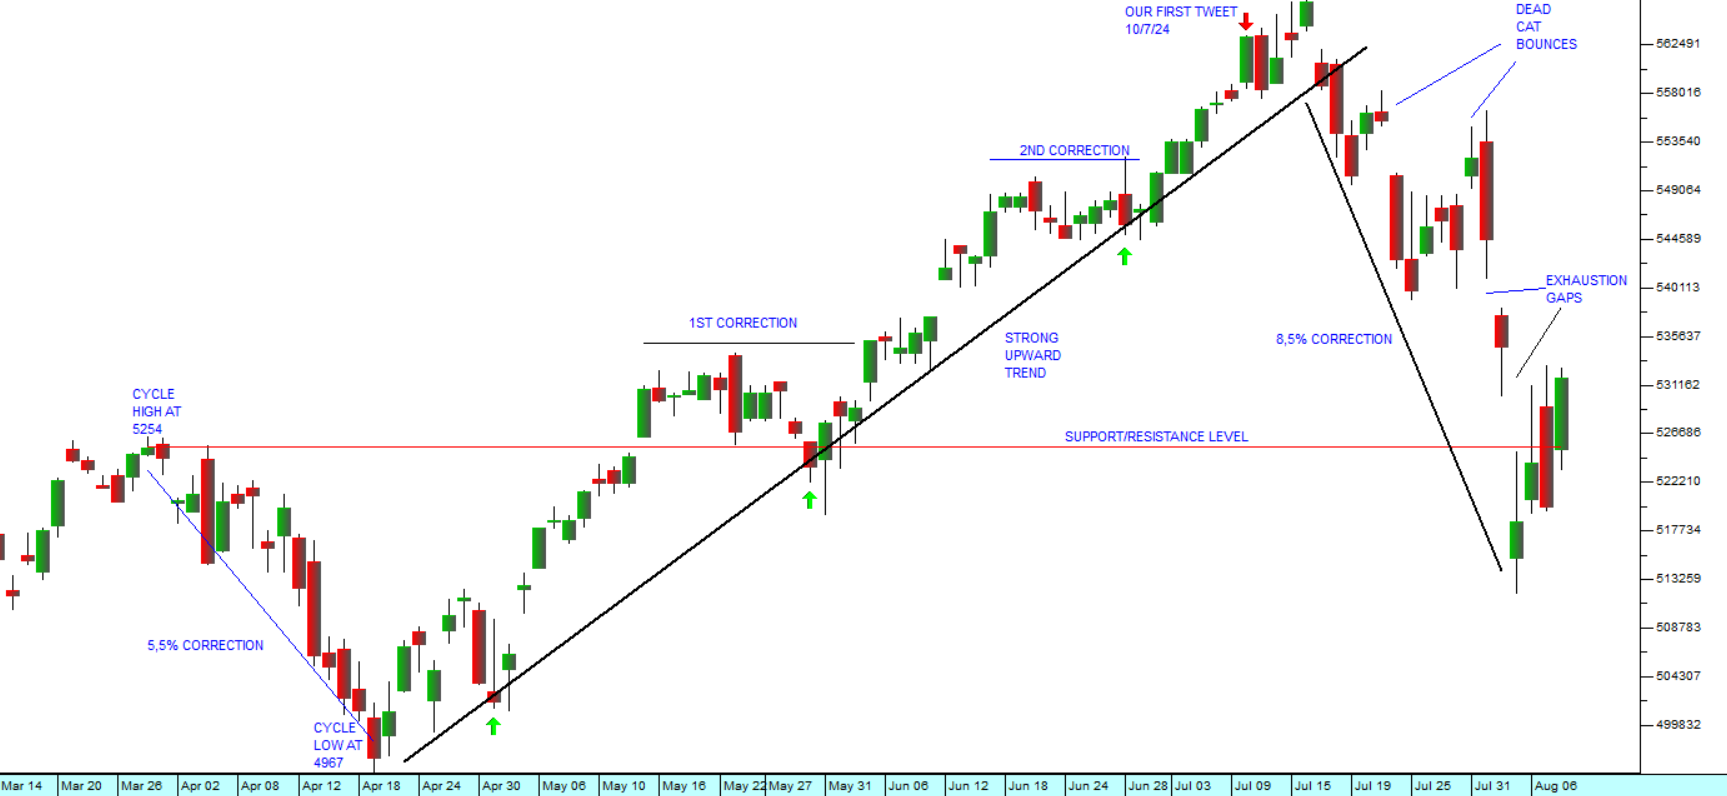
The correction has included two “dead cat bounces” and two “exhaustion gaps” and it has gone further than the previous correction in March/April which only saw the index fall 5,5%.
So now the question is, “Has it reached its lowest point, or will it fall further?”
To begin with, it is our view that this is definitely a correction within a long-term bull trend – and not the start of a new bear trend. So, we fully expect that after this correction has run its course, the S&P will recover and go on to make further record highs.
Following the cycle low (4967.23) of the 19th of April 2024, after the previous correction, the S&P entered an upward trend which was characterised by unusually strong bullish sentiment. The sentiment was so strong that the two “corrections” in that upward trend were flattened out by enthusiastic, mostly inexperienced, investors “buying the dip”. The two exhaustion gaps in the current downward trend show that many of those inexperienced investors have now been flushed out of the market after taking heavy losses.
Despite that, considerable bullish sentiment appears to remain present in the market. In the five trading days following the low point on 5th August 2024, the market has again moved up strongly, indicating that there is still considerable belief that the great bull market will resume.
This correction came about ostensibly because of a rash of negative sentiment about the state of the US economy. But the reality is that the S&P had risen too far, too fast and was overdue for some sort of downward trend. The poor manufacturing data and the weak non-farm jobs report in July gave this position some credence.
The consequent flurry of profit-taking caught many of the less-experienced investors by surprise, causing some panic selling, especially on Monday the 5th of August, when the index fell by 3% in a single trading day.
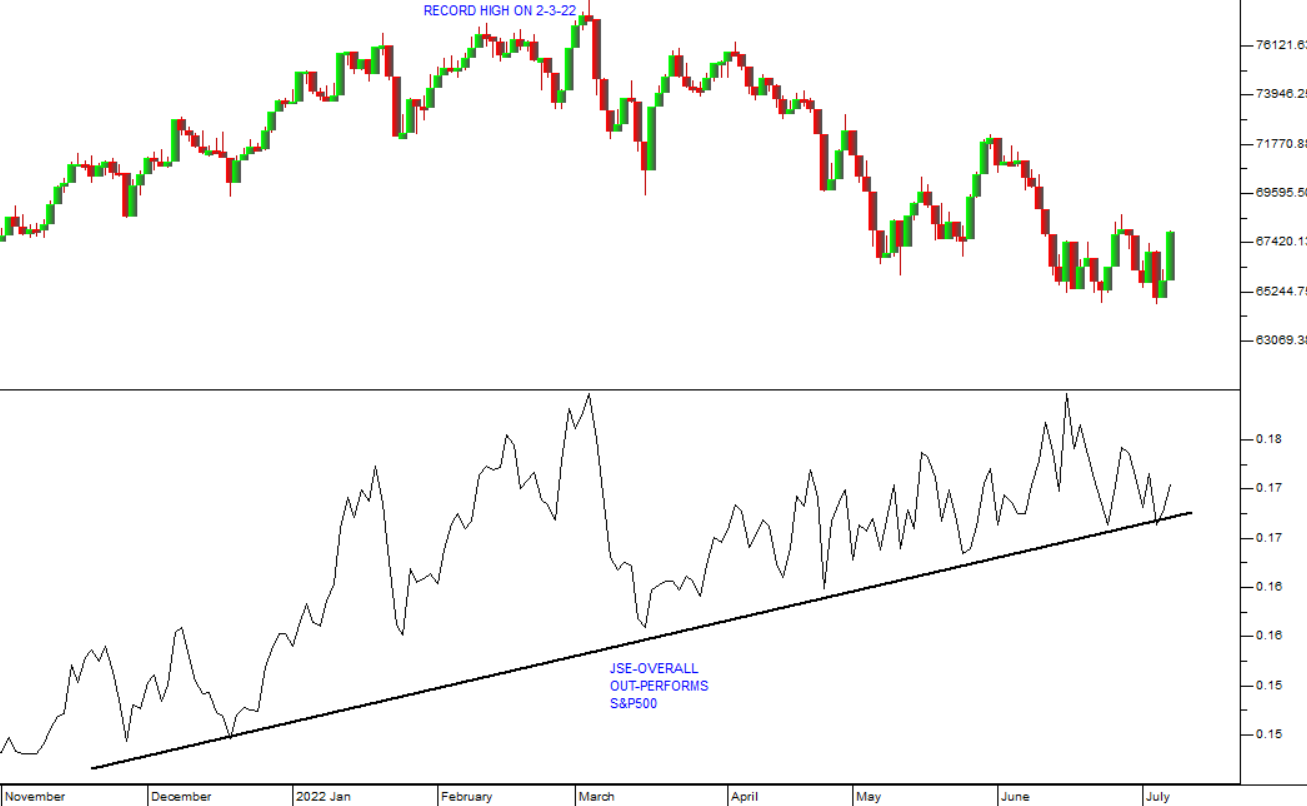
It is notable that the JSE Overall index (J203) has fallen by less than half of the fall in the S&P500, indicating that local investors did not and do not regard the downward trend on Wall Street as particularly serious or persistent. When considering this, you should remember that our market is well supported by overseas investors during periods when sentiment is generally “risk-on”. Consider the chart:
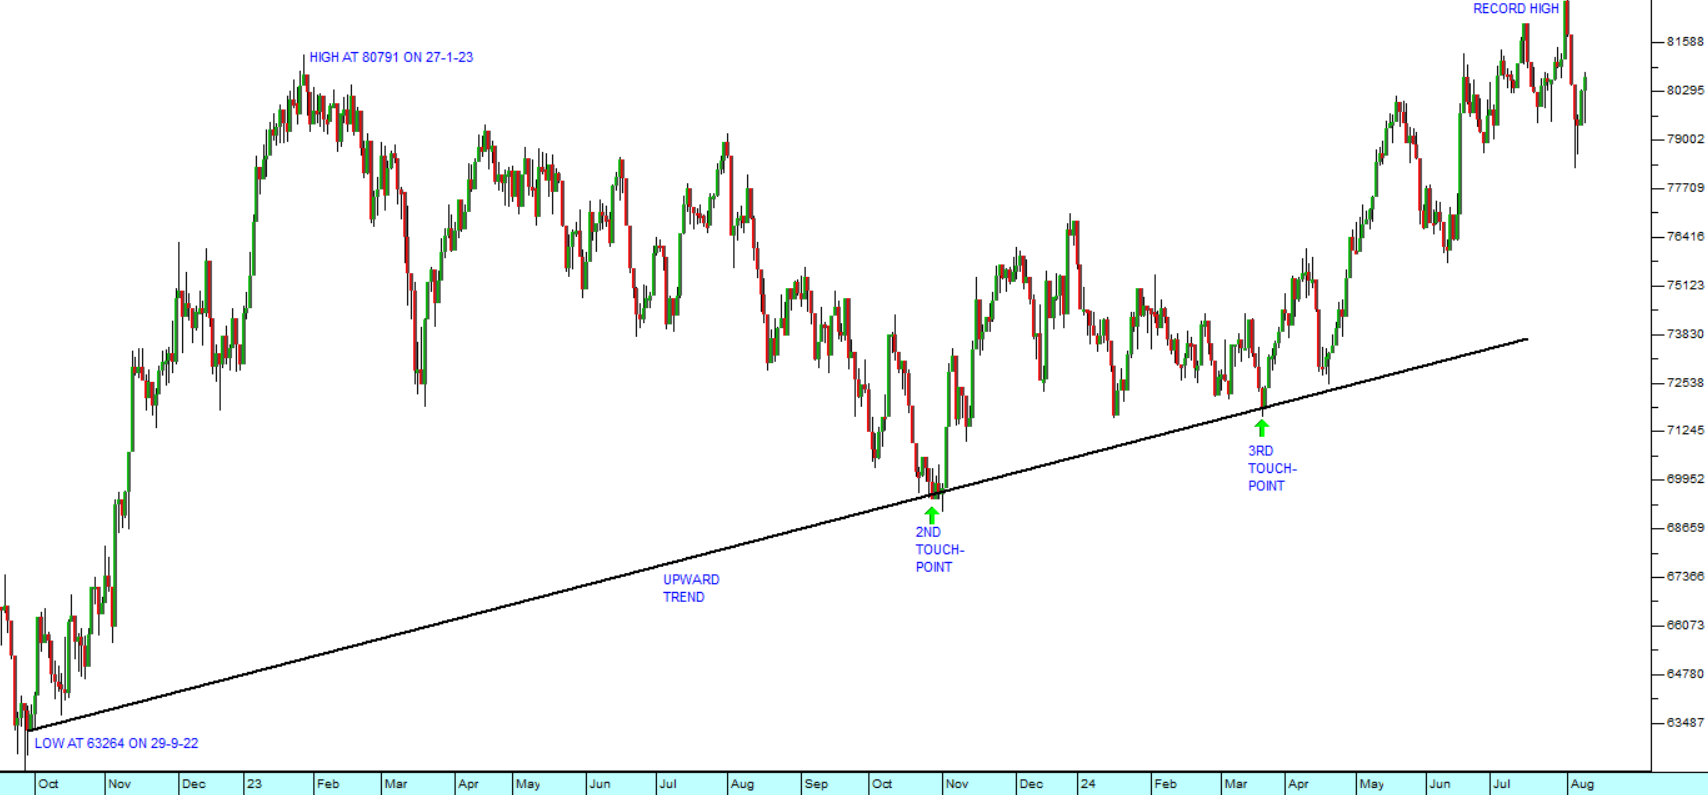
You can see here that the JSE Overall index, although volatile, has been in an upward trend since its low point of 63264 made on the 29th of September 2022 and that it recently made a new all-time record high at 82765 on the 31st of July 2024. The upward trendline is well supported by two touch points on the 26th of October 2023 and the 18th of March 2024. We fully expect that upward trend to continue.
In our view, this sell-off on the US market represents a potential buying opportunity.
DISCLAIMER
All information and data contained within the PDSnet Articles is for informational purposes only. PDSnet makes no representations as to the accuracy, completeness, suitability, or validity, of any information, and shall not be liable for any errors, omissions, or any losses, injuries, or damages arising from its display or use. Information in the PDSnet Articles are based on the author’s opinion and experience and should not be considered professional financial investment advice. The ideas and strategies should never be used without first assessing your own personal and financial situation, or without consulting a financial professional. Thoughts and opinions will also change from time to time as more information is accumulated. PDSnet reserves the right to delete any comment or opinion for any reason.
Share this article: