Sasol
12 February 2024 By PDSNETSasol is a company originally established in September 1950 by the National Party, to counter the possibility of petrochemical sanctions against the old South Africa. Essentially, Sasol used South Africa’s enormous coal reserves to generate about one third of its fuel requirements. Subsequently, Sasol became involved in the chemical industry which now accounts for about half of its business.
Sasol is a massive company with an annual turnover of R289,6bn in the year to 30th June 2023. Its performance is a direct function of the oil price and the basket of chemicals it produces. It is a price taker and not a price maker. However, it is mostly very profitable, generating huge quantities of cash from the various businesses that it engages in.
As an investment, it is volatile and that volatility has resulted in it having a very low price:earnings ratio (P:E) and a very high dividend yield (DY) – which is obviously attractive to private investors. Right now it is trading on a P:E of 2,73 and a DY of 9,28% which compares with the JSE’s average P:E of 10, 46 and DY of 4,25%.
In its recent trading statement for the six months to 31st December 2023, the company estimated that headline earnings per share (HEPS) would come in at between R17.90 and R22.20 which is considerably lower than the HEPS for 2022 of R30,90 – but still amounts to a solid profit.
The decline in profitability is due to the drop in oil and chemical prices worldwide. Sasol has clearly gone right out of fashion as an institutional investment. Fund managers have been off-loading the share steadily for the past 19 months and the share price has been in a downward trend as a result.
But this is a massive company which is very profitable. It is not going into liquidation – and therefore at some point its share price must turn and start to go up. The oil and petrochemicals prices will not fall forever.
As a private investor, you need to use your best endeavours to determine exactly when that moment will arrive. Consider the chart:
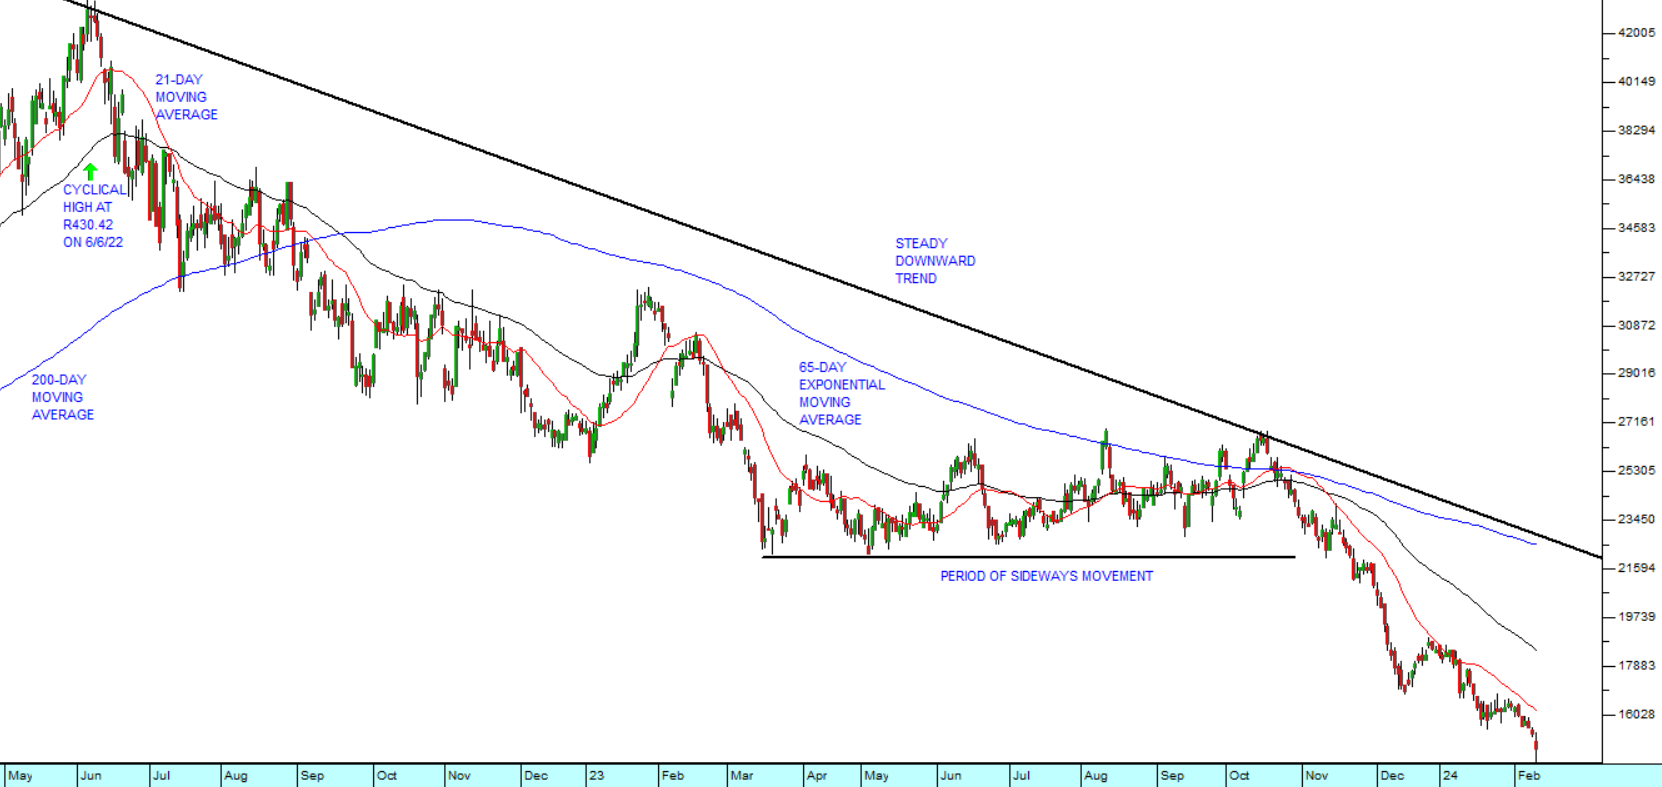
The chart shows Sasol’s cyclical high at R430.42 made on 6th June 2022 – just 19 months ago. Since then, the share has off-loaded almost two-thirds of its value and closed last Friday at R146.55. It cannot fall indefinitely. At some point sentiment will turn and the share will again be perceived as “cheap” by the fund managers. When that happens, they will begin buying it again and the share price will rise giving you the opportunity to make a capital gain.
So, your problem, as a private investor, is to try to determine exactly when it reaches its lowest point. The danger, of course, is that the share will fall further after you have bought in. To counter that possibility, you need to have a strict stop-loss strategy that limits your loss to not more than 10% if you get it wrong – bearing in mind that, with a volatile share like Sasol, you could see your money triple or better if you get it right.
There are many methods for determining when a share has turned. They range from the conservative, like waiting for it to break up through its downward trendline, to using a 21-day simple moving average and waiting for an upside break. In general, the more conservative your approach, the later you will get into the new upward trend when it arrives, but the more secure you will be when you do.
On the chart above, the earliest signal will come when the share price breaks up through the 21-day simple moving average (red). The next signal, coming somewhat later, when it crosses the 65-day exponentially smoothed moving average (black) and then finally the most conservative will be when it crosses the 200-day moving average (blue) and the medium term downward trendline. As always in the share market, you will trade off profit for security.
But you should remember that at whatever moment you decide to take the plunge and buy the share, you will be doing a whole lot better than those institutional fund managers who filled their pockets with Sasol shares back in June 2022 at a price of R430 per share.
DISCLAIMER
All information and data contained within the PDSnet Articles is for informational purposes only. PDSnet makes no representations as to the accuracy, completeness, suitability, or validity, of any information, and shall not be liable for any errors, omissions, or any losses, injuries, or damages arising from its display or use. Information in the PDSnet Articles are based on the author’s opinion and experience and should not be considered professional financial investment advice. The ideas and strategies should never be used without first assessing your own personal and financial situation, or without consulting a financial professional. Thoughts and opinions will also change from time to time as more information is accumulated. PDSnet reserves the right to delete any comment or opinion for any reason.
Share this article: