Grand Parade Trendlines
15 November 2021 By PDSNETTechnical analysis, which is the search for and analysis of patterns in share price charts, can become very complex and mathematical. Literally thousands of line indicators have been developed which claim to improve the investor’s probability of being right when determining the moment when a share’s price turns. In our experience, the best approach is to choose a few technical indicators and become thoroughly familiar with them – so that you develop a “feel” for their interpretation.
One of the best indicators is the humble trendline and it has the great benefit of also being one of simplest. A trendline is a straight line connecting two or more “touch points” in a trend. These touch points are the high points when the share is falling, and the low points when it is rising. Very often trendlines connect more than just two touch points and the general rule is that the more touch points a trendline has, the more reliable it becomes.
Let us look at the example of Grand Parade Investments (GPI). Consider the chart:
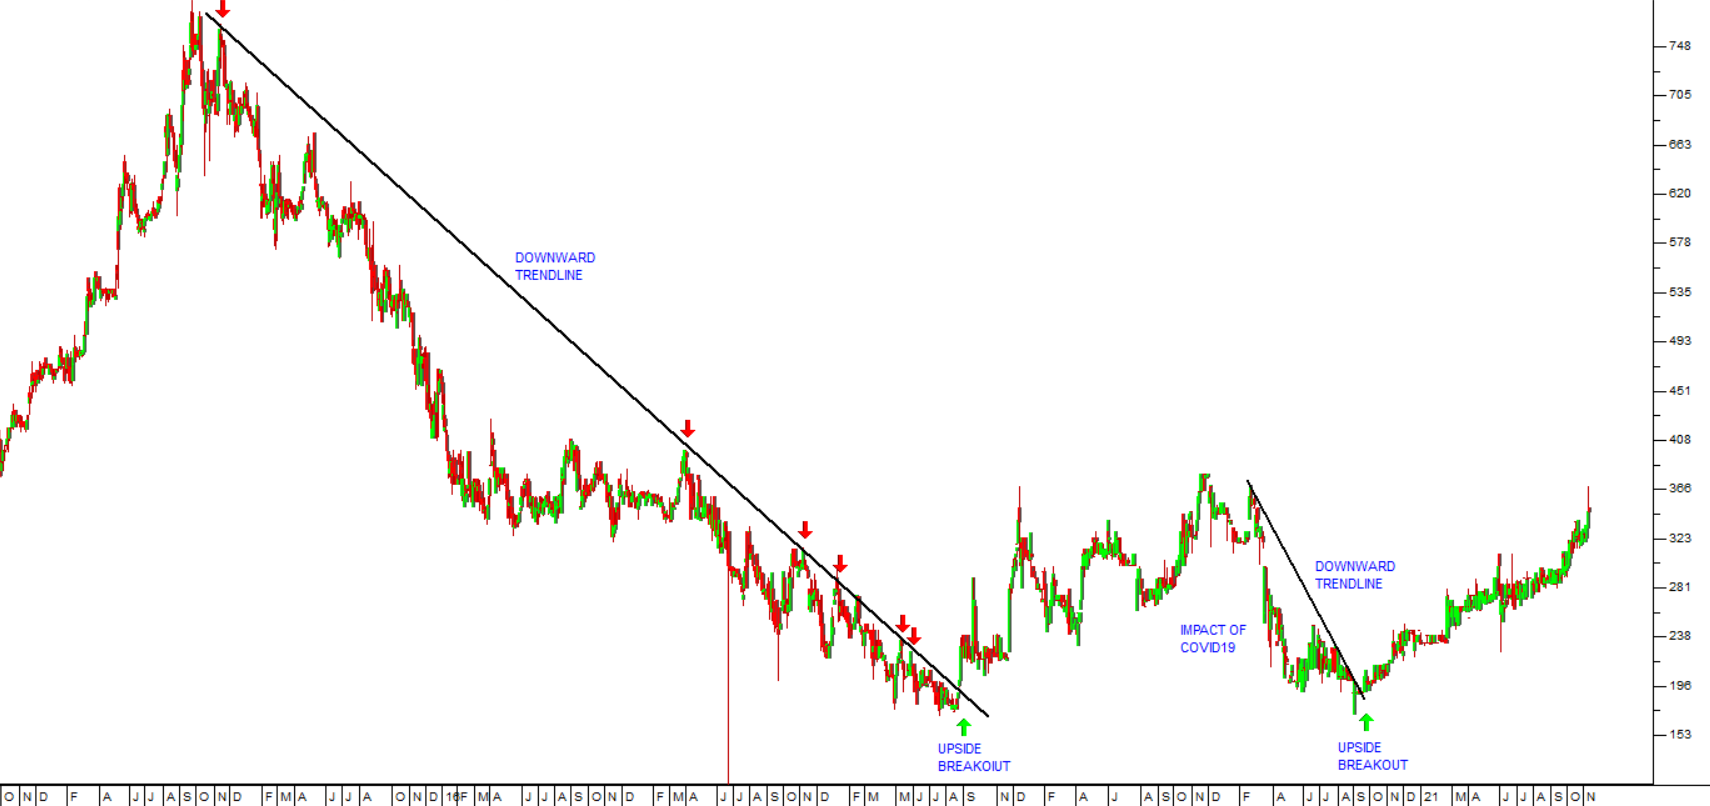
You can see here that Grand Parade’s shares had been falling for a four-year period from October 2014 to September 2018. This was due to its disastrous foray into the fast-food business. The company bought and tried to run various overseas food franchises, including Dunkin Doughnuts, Baskin Robins and Burger King. Eventually it made the decision to sell these franchises and focus on its gaming businesses. Notice that the downward trendline has six touch points which we have highlighted with red arrows. This makes it a very reliable trendline. We advised investors to wait for an upside breakout.
Once that decision to get out of the food business was taken, the share began to recover and broke up through the trendline on 27th August 2018 at 201c. After that it did well until the start of the pandemic in 2020, which had a very negative impact on both casinos and restaurants.
The share fell heavily and, once again, we advised waiting for an upside breakout through the downward trendline. That upside break came on 18th September 2020 at a price of 190c. Since then, the share has risen to its current price of 348c – a gain of 83% in just over a year.
Its stake in Burger King was the last food asset to go after some temporary and irrational resistance from the Competition Commission. Burger King and the Grand Foods Meat Plant were sold in a deal worth R570m. Last Thursday (11-11-21) the company announced that an amount of R465,4m had been received, of which about R88m had to be used to settle debt, but the balance was to be given to shareholders in a special dividend of 88c per share.
This dividend, of course, is subject to dividend withholding tax (DWT) of 20% - so shareholders will actually receive 70,4c per share – which they can add to the substantial capital gain which they have already made.
So, we advise you to apply trendlines – especially, to shares which have fallen heavily or for a protracted period – and then simply wait for an upside break. Note that trendlines can also be used to determine when an upward trend has ended. Looking at the above chart try to see where upward trendlines could be positioned.
DISCLAIMER
All information and data contained within the PDSnet Articles is for informational purposes only. PDSnet makes no representations as to the accuracy, completeness, suitability, or validity, of any information, and shall not be liable for any errors, omissions, or any losses, injuries, or damages arising from its display or use. Information in the PDSnet Articles are based on the author’s opinion and experience and should not be considered professional financial investment advice. The ideas and strategies should never be used without first assessing your own personal and financial situation, or without consulting a financial professional. Thoughts and opinions will also change from time to time as more information is accumulated. PDSnet reserves the right to delete any comment or opinion for any reason.
Share this article:
.png)