New Record High
25 October 2021 By PDSNETAs we predicted, the S&P500 reached a new all-time record high on Thursday 21st October 2021 at 4549.78. This officially means that the correction that it was going through is over. That correction took the index down to a closing low of 4300.46 (on 4th October 2021) – which is a 5,2% decline from the cycle high of 4536.95 made on the 2nd of September 2021.
In the end, this turned out to be yet another “mini-correction” of less than 10% - the 10th since the COVID-19 V-bottom last year. This means that the major correction, of between 10% and 20%, which we have been talking about, is still coming.
What was notable about this correction, when compared to previous mini-corrections, was the duration of the downward trend and the sharpness of the recovery. It took 21 trading days to reach its low – which means that the bears really intended to take the market further down. They were strongly opposed by significant bullish sentiment which was evident in the “buy the dips” rhetoric and so prevented the correction from gaining any momentum. Then, when it became obvious that the bears were losing direction, the recovery was rapid – taking just 6 trading days to reach new record territory.
The bulls clearly took heart from the fact that the potentially dangerous month of October was substantially behind them, and the traditional Christmas rally was imminent. Consider the chart:
.png)
The last three days on the chart above were characterized by backing and filling as the index struggled to rise above the previous cycle high of 4536.95. The final day on the chart above was last Friday (22-10-21) which was characterized by a “long-legged doji” candle where the S&P went well above and below its opening but ended up just slightly down on the day: Consider the market action of Friday 22nd October 2021:
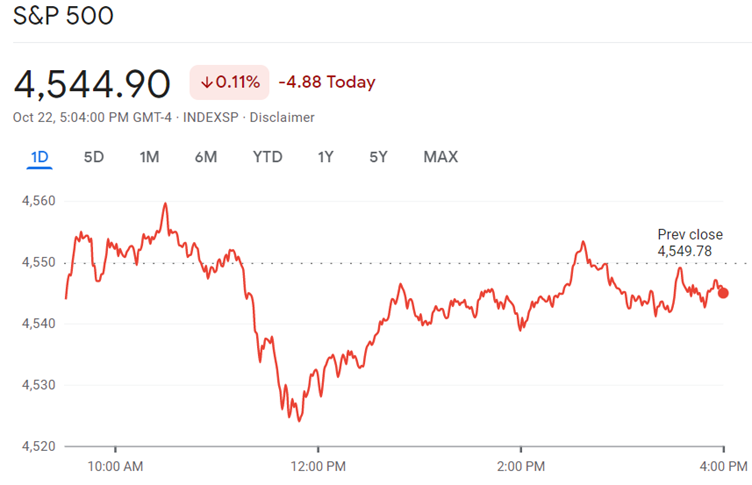
The intraday market action for Friday shows that there is still considerable uncertainty in the market about the new record closing high. You can see how the index, having made an all-time intra-day record high (4559.67), made a low of 4524 and then struggled to remain close to the previous day’s record closing high. The danger, of course, is that the new record high close could turn into a “double top” – which is a bearish formation. Technical analysts all over the world are now waiting to see if the upside break can be sustained and extended – or if the bearish sentiment will return to take the index down again, thus forming a double top.
You might wonder why we are so preoccupied with the minutiae of the S&P’s progress. The reason is that the stock markets of the world, including the JSE, tend to follow the S&P – so it is always your best indication of what is likely to happen. As a private investor, you need to always be watching the S&P to see where world markets are and where they are going. The direction of the S&P will establish whether you are looking at a bull trend or a bear trend. It will give you an indication of whether this just a correction and therefore a buying opportunity, or the start of a new bear trend, which would mean that you should be out of the market completely.
Our view is, and always has been, that we are in a mature primary bull trend, which is being peppered by mini-corrections (of less than 10%), but that we are over-due for a major correction of between 10% and 20% - which now seems unlikely to happen before next year.
DISCLAIMER
All information and data contained within the PDSnet Articles is for informational purposes only. PDSnet makes no representations as to the accuracy, completeness, suitability, or validity, of any information, and shall not be liable for any errors, omissions, or any losses, injuries, or damages arising from its display or use. Information in the PDSnet Articles are based on the author’s opinion and experience and should not be considered professional financial investment advice. The ideas and strategies should never be used without first assessing your own personal and financial situation, or without consulting a financial professional. Thoughts and opinions will also change from time to time as more information is accumulated. PDSnet reserves the right to delete any comment or opinion for any reason.
Share this article:
.png)