Calgro-M3
11 October 2021 By PDSNETCalgro used to be the darling of the institutional investors. Every fund manager in South Africa was buying the share and it rose dramatically from as little at 50c in February 2011 to an intraday high of 2275c on 11th August 2015. At this point it had a market capitalisation of R2,8bn and was trading on a price:earnings (P:E) ratio of 20,5. Not bad for a nascent property developer. Consider the chart:
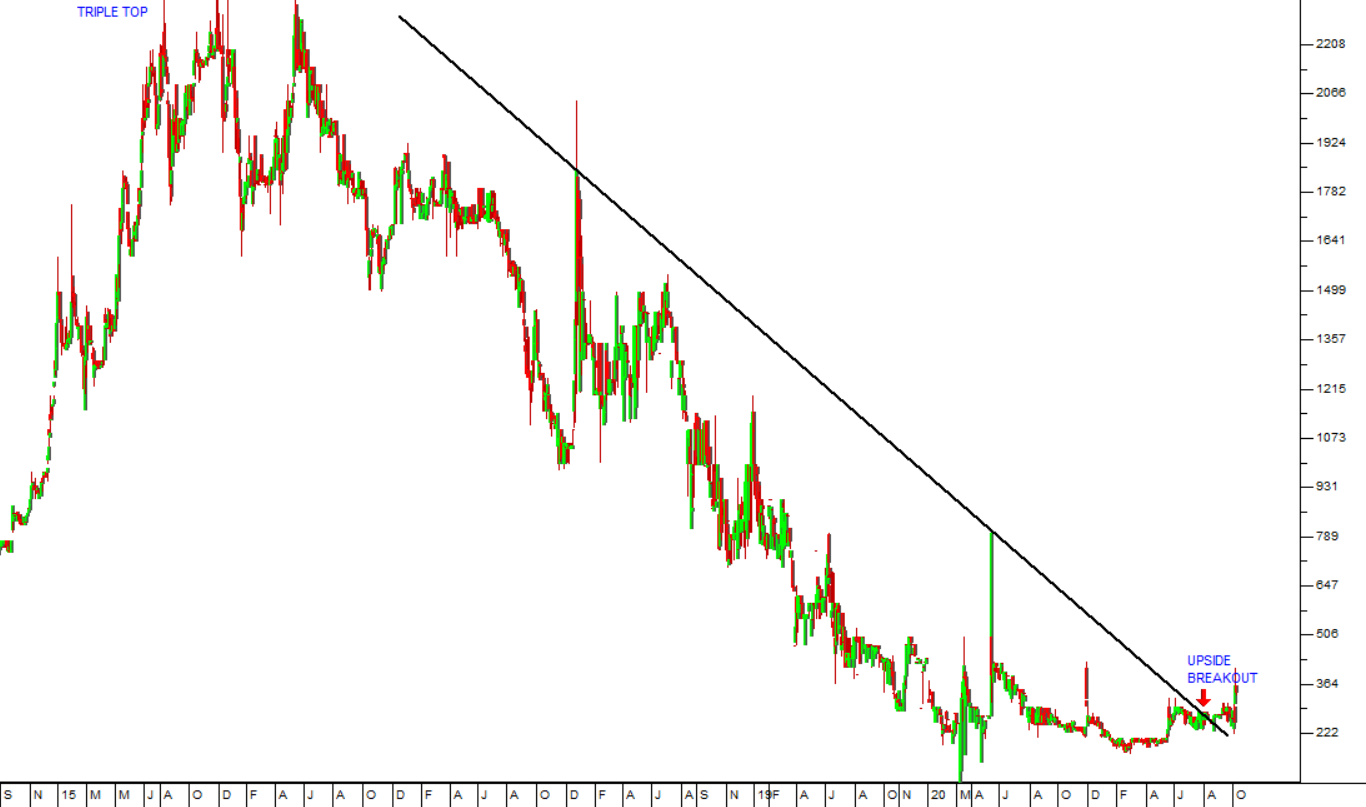
From the high point in August 2015, Calgro’s share price made what technical analysts call a “triple top” with tops on 12/8/2015, 21/12/2015 and finally 13th May 2016 – all at 2350c. It could not seem to penetrate that level despite all the great publicity it was getting at the time. For technical analysts, a triple top is a very bearish sign. It normally comes before a major downward trend.
In our view, a triple top is caused by one or more major shareholders off-loading their shares because of some bad news. The bad news is not known to the investing public but the major shareholders are privy to it because they are very close to the company. Each time the share reaches that level they take the opportunity to off-load causing the share to fall back, but it rises again because all the news, in the financial media, is very positive. However it cannot penetrate that high and falls back again. The third time this happens, investors give up and begin to abandon the share – resulting in a protracted downward trend. A very similar pattern (a triple top) occurred in Steinhoff shares between March and August 2016 – and as we now know, the share has subsequently fallen from around R90 to a low of just 70c in September 2020.
For the next five years after the triple top, Calgro shares fell steadily in a long downward trend which came to an end on 17th February 2021 at a price of just 170c. Our advice to our customers through this time was to wait for a clear upside breakout through that trendline. That breakout finally came on 24th August 2021 at a price of 272c. Since then, the share has moved up to 340c – a gain of 25% in about six weeks.
This company has been through a tough 4 years but is now beginning to function effectively again. They have 4654 residences under construction compared to half that number a year ago and their memorial park business saw turnover up 65.2%, albeit off a low base. They have managed to reduce their debt significantly and bought back 4,6% of their issued share capital.
With their latest trading statement for the six months to 31st August 2021, Calgro is expecting to return to profit with headline earnings per share (HEPS) of over 40c – but as a private investor you could have bought the share ahead of this news at 272c, when it broke up through its long-term downward trendline. We believe that its new upward trend has only just begun.
DISCLAIMER
All information and data contained within the PDSnet Articles is for informational purposes only. PDSnet makes no representations as to the accuracy, completeness, suitability, or validity, of any information, and shall not be liable for any errors, omissions, or any losses, injuries, or damages arising from its display or use. Information in the PDSnet Articles are based on the author’s opinion and experience and should not be considered professional financial investment advice. The ideas and strategies should never be used without first assessing your own personal and financial situation, or without consulting a financial professional. Thoughts and opinions will also change from time to time as more information is accumulated. PDSnet reserves the right to delete any comment or opinion for any reason.
Share this article:
.png)
.png)