Fundamental Context
21 June 2021 By PDSNETThe assessment of shares is divided into fundamental analysis and technical analysis. The fundamentalist is trying to answer this question, “How good will this company be as a payer of dividends in the future ?” This requires an in-depth study of everything about the company starting with its most recent financials.
Private investors typically shy away from looking at company’s financials because it can be tedious to wade through pages of figures trying to make sense of them, especially if you don’t have an accounts background. But you should know that Warren Buffett, who is arguably the most successful investor who has ever lived, studies about 2000 sets of financial statements every year – that is the secret of his amazing success!
In this article I will look at the Invicta (IVT) financials and show how you can understand the context of exactly where the company is now in its financial cycle, together with a few simple common sense ideas that anyone can apply and understand, even if they are not an accountant.
Listed companies publish their financials in “short form” on the Stock Exchange News Service (SENS) but always give a link to where you can download their full financials in PDF format. You can obtain Invicta’s financials at the following link:
https://senspdf.jse.co.za/documents/2020/jse/isse/IVT/Int2020.pdf
Your first step in fundamental analysis is to find out where the company is in its financial cycle. Most companies have a financial year-end on 31st December or 30th June, but there are quite a few with year-ends at 30th September and 31st March and there are a few with year-ends at the end of other months. Invicta’s year-end is at 31st March – so it is just about to publish its results for that period.
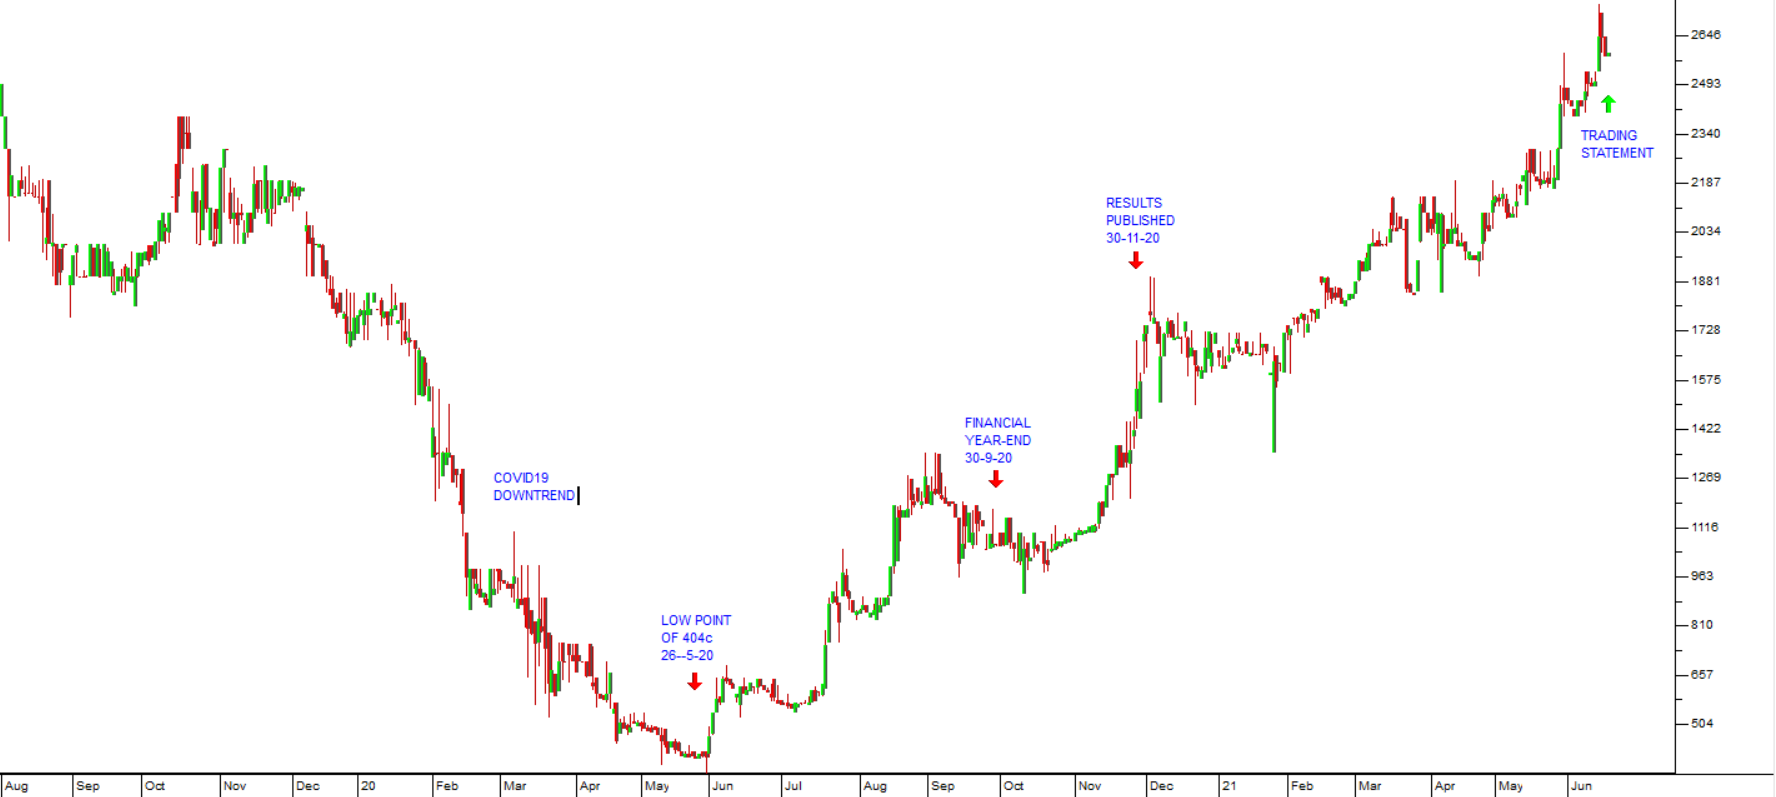
The chart shows the downtrend associated with COVID-19 reaching a low point of 404c on 26th May 2020. This was followed by an upward move as investors began to anticipate that the results for the six months to 30th September would show a big improvement.
The actual publication of those “interim” results came two months later on 30th November 2020 and showed that the company had made a profit of R224m off revenue of R3,57bn. Their revenue was 18% lower than in the previous interim period mainly as a result of the pandemic, but their profit was up 7,7%. This immediately showed that Invicta’s management had coped with the COVID-19 crisis extremely well, squeezing 7,7% more profit out of 18% less sales.
Now, six months later, in its trading statement for the full year to 31st March 2021, the company is anticipating that HEPS will rise to between 310c and 321c – a massive improvement from the 58c which it made in the year to 31st March 2020.
It is important to understand that the interim financials only show the company’s performance for the first six months of its financial year, while the “final” financial statement shows its performance for the whole year. So, interims can only be compared to interims and finals can only be compared to finals.
Perhaps the most important point that you can take out of this discussion, however, is that investors anticipate the future performance of a company and “discount” it’s expected performance into the share’s price. Thus, Invicta’s share price began to rise as early as May 2020 in anticipation that its results for the six months to the end of September would be much improved – and then, later, in anticipation of even better news for the year-end results, they pushed the share price up even further.
That discounting process has resulted in the share rising from 404c in May last year to its current price of 2600c – a gain of more than 540% in 13 months!
We suggest that you take the time and trouble to download and study the financial statements of those companies which interest you. Even if you don’t understand everything you read, you will find plenty of very interesting and useful information there.
DISCLAIMER
All information and data contained within the PDSnet Articles is for informational purposes only. PDSnet makes no representations as to the accuracy, completeness, suitability, or validity, of any information, and shall not be liable for any errors, omissions, or any losses, injuries, or damages arising from its display or use. Information in the PDSnet Articles are based on the author’s opinion and experience and should not be considered professional financial investment advice. The ideas and strategies should never be used without first assessing your own personal and financial situation, or without consulting a financial professional. Thoughts and opinions will also change from time to time as more information is accumulated. PDSnet reserves the right to delete any comment or opinion for any reason.
Share this article:
.png)