Aspen
14 March 2021 By PDSNETThe relationship between technical analysis and fundamental analysis is the relationship between the reality and the perception of that reality in a company. The fundamentalist searches for the share’s real value by studying the company’s financials. The technician studies the impact of investors’ perceptions as they are reflected in the share’s price and volume pattern.
The share’s price and volume movement can also sometimes be a good indication of the inside information known only to a select few within the company.
The investment analyst community mostly relies on a detailed evaluation of the financials supplemented with information obtained from the company’s top executive in interviews. The problem with that is that the company’s financials are anything between 3 months and 15 months old which tends to limit their value. Furthermore, the financials are not always an accurate representation of what happened in the company (as has been the case with Steinhoff, Tongaat et al).
But there can be no doubt, however, that, despite their limitations, the fundamental facts, when they are known and accurate, do impact share prices.
In the case of Aspen Pharmacare (APN), it published its results for the six months to 31st December 2020 last Friday (12-3-21). On the day, the information did not have a major impact on the share’s price – which implies that it had mostly been ascertained by the investment analyst community and contained relatively few surprises.
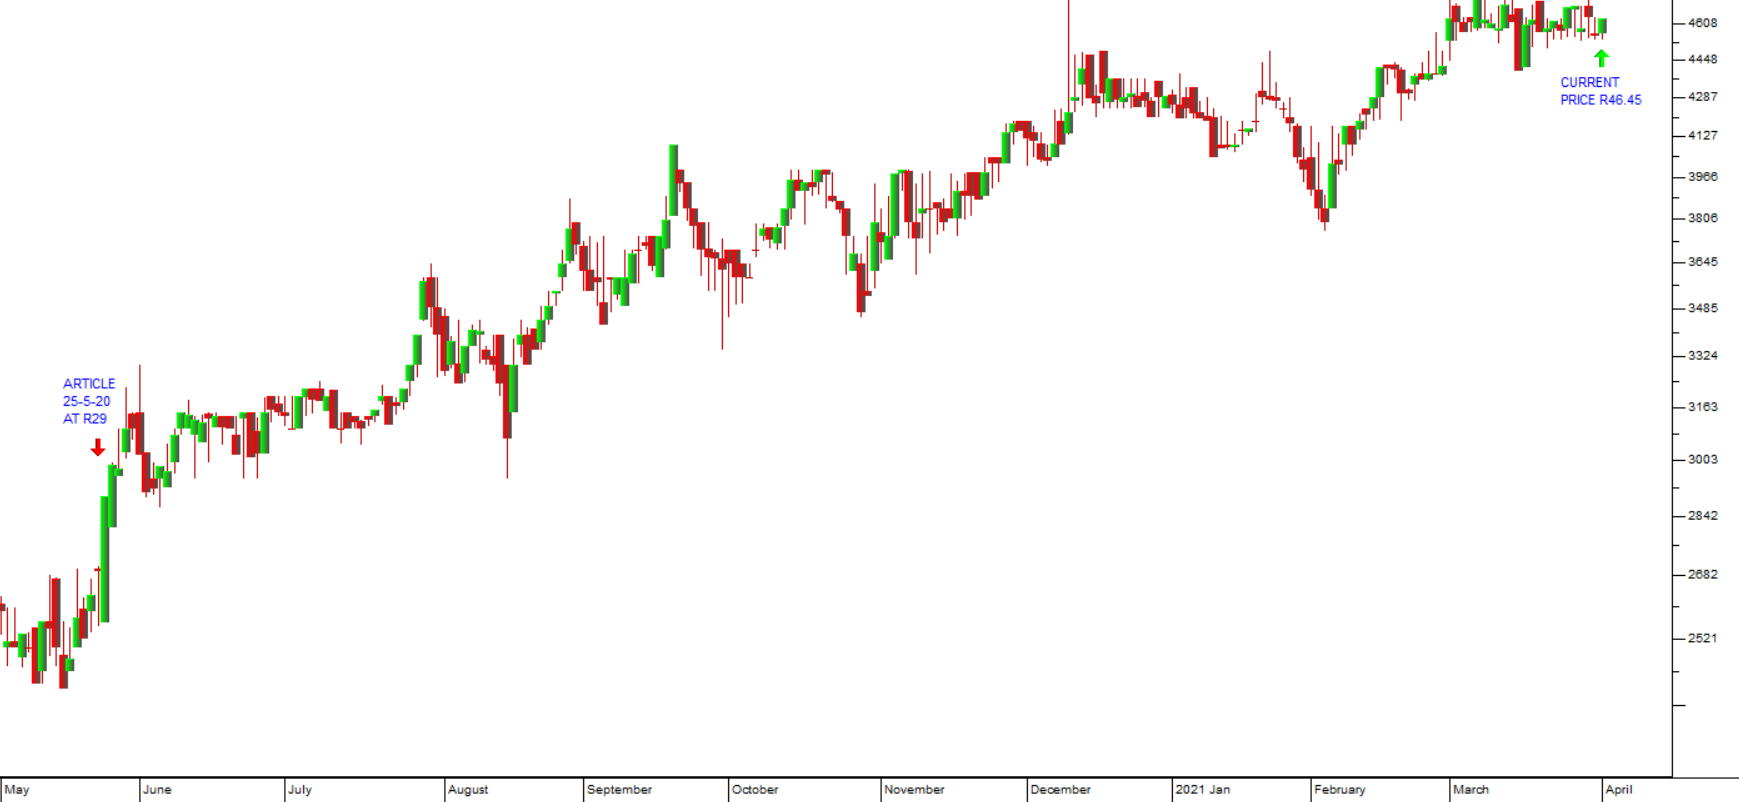
Everyone knew that Aspen was trying to reduce its debt levels. By the end of 2014, the board had allowed debt to reach unacceptable levels and ultimately had to sell its European Thrombosis assets and other assets to bring the debt down. By 31st December 2020 debt was down to R27,7bn from R35,2bn six months before and finally within the company’s debt covenants. A further R7bn was expected from the sale of the European Thrombosis assets which would bring debt levels down further to just over R20bn. Consider the chart:

Here you can see that until the start of 2015, six years ago, Aspen, an institutional favourite as a blue-chip rand-hedge share was rising steadily. Then the analysts began to become concerned about its debt levels and the share entered a period of sideways movement with declining tops and support at about R244. Those fears reached a climax in September 2018 and the share fell sharply to levels around R70 by August 2019 as the investment community tried to digest the implications of its over-gearing.
From that point the recovery began as the company’s board of directors realized that they would have to sell assets to bring the debt back under control. Their seriousness about reducing the company’s gearing resulted in a new upward channel which is still in progress.
In our view, this is a massive international pharmaceutical company which offers the private investor a solid rand-hedge. It is inherently profitable, and it is in an industry whose high-margin products are always going to be in demand. If management had not become excessively enthusiastic about new acquisitions, gearing levels would have remained under control and the growth path up to 2015 would have continued indefinitely.
The current situation therefore represents a buying opportunity. This share, which you can buy for under R150 today, once traded for R434 – so we believe that there is still plenty of upside potential.
DISCLAIMER
All information and data contained within the PDSnet Articles is for informational purposes only. PDSnet makes no representations as to the accuracy, completeness, suitability, or validity, of any information, and shall not be liable for any errors, omissions, or any losses, injuries, or damages arising from its display or use. Information in the PDSnet Articles are based on the author’s opinion and experience and should not be considered professional financial investment advice. The ideas and strategies should never be used without first assessing your own personal and financial situation, or without consulting a financial professional. Thoughts and opinions will also change from time to time as more information is accumulated. PDSnet reserves the right to delete any comment or opinion for any reason.
Share this article: