Market View
J200 105,635.00 -1.24% J203 113,323.00 -1.18% J210 123,975.00 -2.13% J211 122,277.00 -0.77% J212 26,153.00 -0.86% J213 139,041.00 -0.79%
Winning Shares (Top 5)
Code Name Added Price Latest % Gain % Gain/Year
REM REMGRO 2025-07-03 16422 19048 +15.99% +14.20%
PPE PURPLE 2025-04-16 120 213 +77.50% +57.85%
VAL VALTERRA 2025-07-03 83183 141268 +69.83% +62.01%
RDF REDEFINE 2025-07-18 480 626 +30.42% +28.04%
EMI EMIRA 2025-07-19 1145 1330 +16.16% +14.93%
Opinions (Top 5)
Code Name Date Action
ABG ABSAGROUP 2026-08-19 View

ABSA (ABG) is one of the largest banking groups operating in Africa. It has well-established branches in 12 African countries and representative offices in at least 6 more. It offers a range of products for personal and business banking, credit cards, insurance, and asset management.

Obviously, as one of the "big five" banks, ABSA has been impacted by the recession in South Africa and the generally low consumer spending in the economy. The company announced a joint venture with Patrice Motsepe's African Rainbow Energy to launch a R6,5bn renewable energy fund.

ABSA is certainly a blue-chip share and is worthy of your attention. The separation from Barclays is now complete. On 31st March 2023 the company announced a BBBEE transaction that will take its Black ownership to more than 25%. In its results for the six months to 30th June 2026 the company reported total income up 4,1% and headline earnings per share (HEPS) up 7,9%.

The company's net asset value (NAV) increased 4,6% to 20968c per share and the cost-to-income ratio was 53,4%. The company said, "The Group’s common equity tier 1 (CET1) capital ratio rose to 12.8% from 12.5%, to remain above regulatory requirements and the top end of the Board’s target range of 11.0% to 12.5%".

Technically, the share made a low in March 2020 and then moved sideways for the next six months before beginning a new upward trend which is ongoing. We are generally very positive about the potential of banking shares on the JSE. ABSA shares have been falling since February 2026 and are now on a P:E of 7,45 and a dividend yield (DY) of 5,88, which looks cheap to us.

The war in Iran has negatively impacted all banking shares, but this will probably prove to be temporary.

NRP NEPIROCK 2026-08-19 View

Nepi-Rockcastle (NRP) is a R124bn real estate investment trust (REIT) which operates more than 56 shopping malls in 9 central and eastern European countries, mostly in Poland (24%), Romania (35%), Slovakia (9%), Bulgaria (8%), Croatia (5%) and Hungary (11%). The share fell with the rest of the Resilient group (as a result of the 360ne report in January 2018) from its high of R217 in December 2017 to as low as R99 in November 2018 and then the COVID-19 pandemic took it down to under R55 in March 2020.

Since then it has staged a recovery to around R143.60. The company's total portfolio is worth 6,3bn euros (R124bn) and it ranks as the largest property share on the JSE. On 1st February 2022 the company announced that it had to pay 30m euros in a civil judgement by the Arbitral Tribunal in Poland.

In its results for the six months to 30th June 2026 the company reported income up 3,8% and headline earnings per share (HEPS) up 2,1%. The company said, "The Board has revised the guidance released in February 2026; and based on the good actual and estimated operational results, now expects DEPS for the year to be 3.5-4% higher than the DEPS of 62.03 cents per share in 2025". Technically, the share has recovered convincingly from the pandemic and has been in an upward trend since 1st November 2023.

We still regard it as good value at current levels and expect the upward trend to continue. 

BHG BHP 2026-08-19 View

BHP is a world-wide commodities company with its headquarters in Melbourne, Australia. It processes minerals, oil and gas and it has 62000 employees, mostly in the Americas and Australia. It produces copper, iron, coal, oil, and gas. BHP owns 57,5% of the Escondida mine in Chile which is one of the world's largest copper producers and also produces some gold and silver.

It owns 33,75% of Antamina in Peru which produces copper and zInc. It owns 100% of Pampa Norte which produces copper cathode in the Atacama Desert in Northern Chile. It owns 50% of Samarco in Brazil which produces iron ore and a one third interest in Cerrejón in Colombia which produces coal from an open-cut coal mine.

It owns mineral rights in Saskatchewan in Canada which contains one of the world's largest unexploited potash deposits. In Australia, BHP owns Olympic Dam which is one of the world's largest copper, uranium, and gold ore bodies. It also owns Western Australia Iron Ore which is a system of five mines connected by more than 1000km of railway lines.

It owns Queensland Coal which comprises the Mitsubishi Alliance and Mitsui Coal. It also owns the Mt. Arthur open-pit coal mine in New South Wales. It owns Nickel West which is a nickel mine with smelters, concentrators, and a refinery. In the petroleum field it owns high quality resources in the Gulf of Mexico, Australia, Trinidad, and Tobago.

This is a diversified international mining company which is impacted directly by commodity prices and hence from any recovery in the world economy. In its results for the year to 30th June 2026 the company reported revenue up 15% and headline earnings per share (HEPS) up 31%. The company said, "We delivered record iron ore production and shipments at WAIO, ~2 Mt of copper for a second year running and a stronger result in coal.

We met or beat guidance across much of the portfolio and achieved industry-leading cost positions". The share was rising steadily since April 2025 and we added it to the Winning Shares List (WSL) on 5th December 2025 at a price of 50350c. It has since risen to 71957c (18-8-26) and we expect it to go further.

It remains vulnerable to commodity prices. On 18th March 2026 the company announced that Brandon Craig succeeded Mike Henry as BHP CEO on 1st July 2026. 

SOH S-OCEAN 2026-08-18 View

South Ocean (SOH) is a manufacturer of low-voltage electrical cables and an importer of light fittings and electrical accessories. The company has an electrical cable manufacturing plant at Alrode and employs 400 people. The company described itself as, "...an investment holding company, comprising two operating subsidiaries which manufacture low voltage electrical cables, and which holds property for investment purposes." It also owns Anchor Park which is a property company.

In December 2010, this share traded for as much as 245c, but then it fell back on persistent losses to trade at around 22c - on very thin volumes. In its results for the year to 31st December 2025 the company reported revenue down 3% and headline earnings per share (HEPS) down 70%.

The company said, "The retention of market share come at a cost of reduced margins due to the continued significant level of finished goods imported since 2023". In a trading statement for the year to 30th June 2026 the company estimated that HEPS was 8,02c compared with a loss of 9,31c in the previous period.

The share was in an upward trend until October 2024 and has since been falling and moving sideways on relatively thin volumes.

RCL RCL 2026-08-18 View

RCL is a large producer of food, sugar products and chicken in South Africa which is owned 80.4% by Remgro. The company owns a number of very well-known South African brands such as 5 Star maize meal, Farmer Brown and Yum Yum peanut butter. It competes with overseas imports of sugar, chicken, and other foods.

It was impacted by the listeriosis outbreak which damaged the market for processed meats and caused costs estimated at about R158m. The company has been impacted by the weak economy, low consumer spending and high unemployment. The company, through the SA Poultry Association is petitioning the International Trade Administration Commission (ITAC) for an 82% increase in the tariffs on imported chicken.

On 2nd December 2020, the company announced that Remgro had increased its stake by buying 100m shares at R8,05 each. On 29th March 2023 the company announced that it had sold Vector Logistics for R1,25bn. On 4th June 2024 the company announced that it would unbundle and separately list Rainbow Chicken.

RCL shareholders got 1 Rainbow share for every RCL share that they held on 25th June 2024. On 10th June 2024 the company published the Rainbow's pre-listing statement with the last day to trade being 25th June 2024. In its results for the six months to 31st December 2025 the company reported revenue from continuing operations down 1,9% and headline earnings per share (HEPS) up down 30,6%.

The company said, "RCL FOODS's underlying EBITDA from continuing operations decreased by 14.6% to R1 185,8 million (December 2024: R1 388,0 million). This result was largely due to adverse market dynamics within the sugar industry which had a material negative impact on the performance of our Sugar business unit".

In a trading statement for the year to 30th June 2026 the company estimated that HEPS would fall by between 30% and 35%. The company said, "The decrease in underlying HEPS from the comparative period is largely due to a significant decline in profitability in our Sugar business unit". The share has been drifting sideways since Rainbow was unbundled.


Winning Share: RDF
Opinion: RCL
A New Record High  (2026-08-16)

A couple of weeks ago we wrote an article about the sideways market that the S&P500 was in at the time. In that article we pointed out that while the market had been moving sideways for three months, the actual companies which the market represented had been continuing to grow and develop. We…

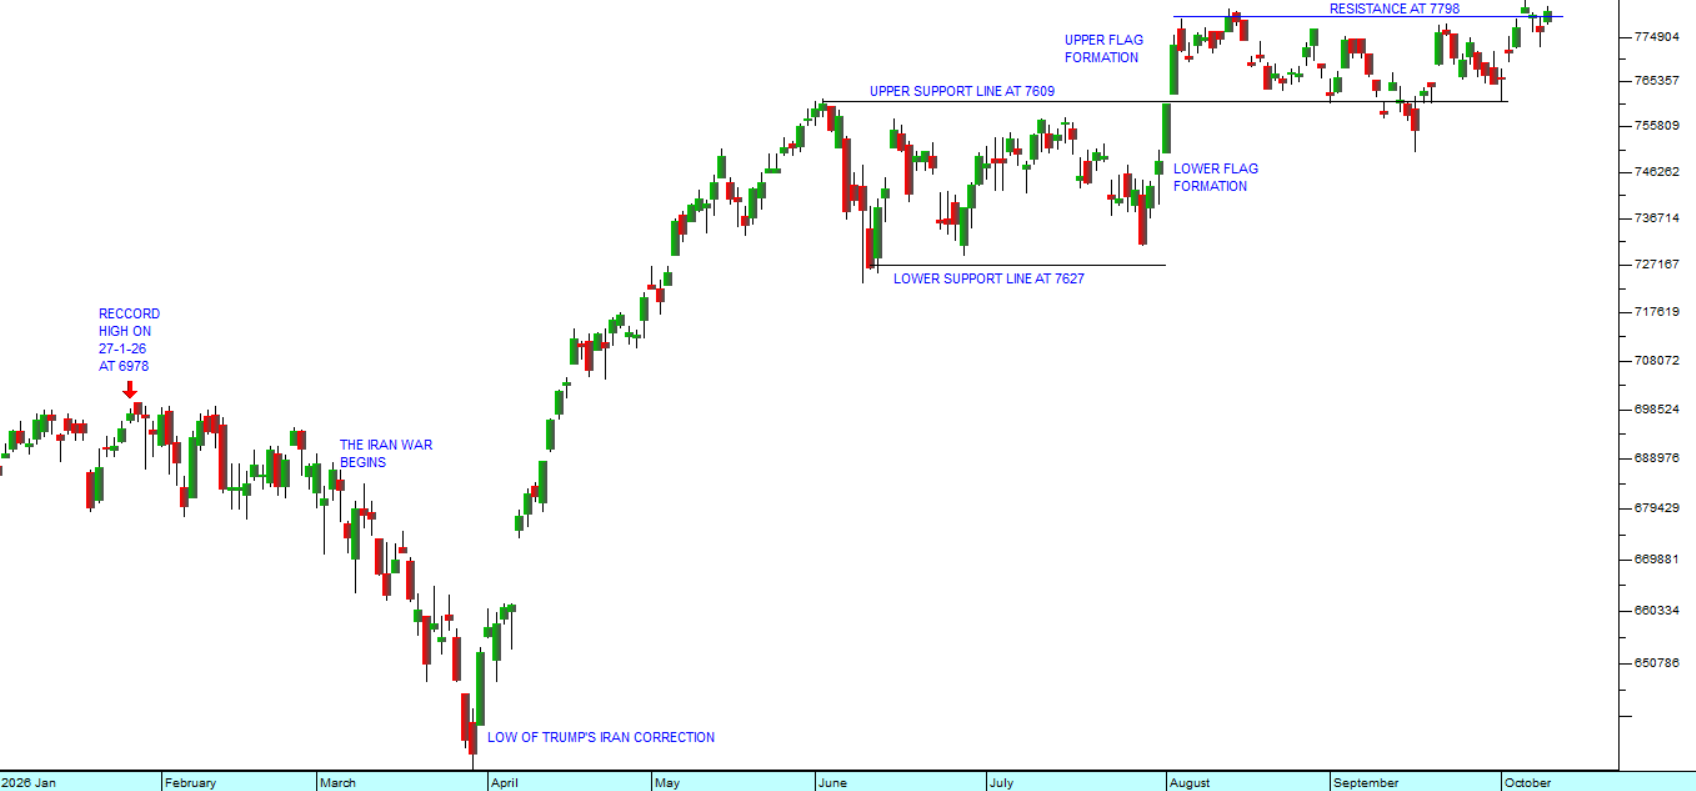
A couple of weeks ago we wrote an article about the sideways market that the S&P500 was in at the time. In that article we pointed out that while the market had been moving sideways for three months, the actual companies which the market represented had been continuing to grow and develop. We anticipated that the market would break to the upside out of that flag formation and that when it did it would have to catch up the growth of the previous three months. Consider the chart:

S&P500 Index :14th of May 2026 - 14th of August 2026. Chart by ShareFriend Pro.

The chart shows how the S&P was moving sideways between the previous record high of 7609 made on the 6th of June 2026 and the low of 7267 made on the 10th of June 2026. Then on the 4th of August 2026 the S&P broke strongly to the upside and made a series of new record highs – just as we expected.

From a fundamental perspective, lower-than-expected inflation and a slower level of job creation gave the market hope that the Federal Reserve Bank would not raise interest rates again at the next meeting of the monetary policy committee (MPC) on the 15th and the 16th September 2026. The consumer price index (CPI) fell to 3,4% in July 2026 from June’s figure of 3,5%. The drop gave investors hope that the worst of the effects of the Iran fuel price hike were behind and that inflation was again moving down.

The producer price inflation figure for the year to the 31st of July 2026 was also encouraging at 4,7% - significantly lower than June’s figure of 5,5% and reflecting the drop-off in the oil price. We believe that interest rates in America will probably remain unchanged until the end of this year.

The stalemate in Trump’s war and its impact on world oil prices appears to have stabilized with North Sea Brent Oil hovering roughly $15 per barrel above where it was before the war began. While developments in the war are still a factor, investors’ attention is back to focusing on the figures coming out of the companies which make up the S&P, especially the so-called Magnificent Seven.

In Q2 2026, Apple was the hero with earnings per share (EPS) up an impressive 29% year-on-year, followed by Microsoft’s 32% gain. Alphabet, Amazon, Meta, and Tesla delivered solid revenue, above forecast, but this was heavily counterbalanced by massive capital expenditure increases mainly for artificial intelligence infrastructure.

Nvidia is reporting its results for the second quarter in a few days’ time on the 26th of August 2026. Wall Street is anticipating another blowout quarter with analysts looking for exponential growth fuelled by the relentless demand for artificial intelligence infrastructure.

What is also clear to us is that Americans are expecting Trump and the Republicans to perform very badly in the coming November mid-term elections, almost certainly losing the House of Representatives and possibly even the Senate. If this happens, it will make Trump into a “lame dog” president, unable to pass any legislation against Democrat opposition. There is also now the clear possibility that he could be forced to resign as a result of increasingly poor health or because he is impeached.

Whatever happens it is clear that his influence over the stock market is declining rapidly. The market has lost interest in his interminable erratic announcements on Truth Social and is instead caught up in the excitement over the productivity benefits of new technologies.

We expect that the S&P will continue to climb to further new record highs and take all world markets up with it, including the JSE. 

Spur Corporation  (2026-08-11)

Everyone in South Africa knows the Spur chain of restaurants. It has been one of the strongest South African brands for decades. Over the years Spur has branched out into a variety of other well-known brands, built its own manufacturing base to supply raw materials to its restaurant chain and…

Everyone in South Africa knows the Spur chain of restaurants. It has been one of the strongest South African brands for decades. Over the years Spur has branched out into a variety of other well-known brands, built its own manufacturing base to supply raw materials to its restaurant chain and expanded internationally. More recently, it has been capitalising on the move towards online ordering of food with many of its restaurants now participating in what it describes as a “virtual kitchen”.

From an investment perspective, the business has the disadvantage of having a working capital element (stock and debtors) and a large staff throughout the country. These risks are substantially mitigated by the fact that most of its restaurants are owned and run by franchisees who are required to buy all their materials from Spur. An important factor is that at 31st December 2025, Spur had over R400m in the bank and almost no appreciable debt. This means that it is well-positioned to take advantage of any opportunities, while being insulated against external shocks.

Of course, the restaurant business is dependent on consumer spending. So, the company’s 753 restaurants need to be constantly patronised by people looking to eat a meal which they have bought rather than cooked themselves. A large proportion of this is sit-down meals in restaurants, but a growing percentage is take-away food ordered online and then delivered.

The restaurant business is based on the reality that everyone has to eat every day and that a good proportion of people will choose at least several times a month to get a ready-made meal even though it is more expensive. Their ability to do this is dependent on their available discretionary cash – and that depends on such things as the increase in real salary levels and the demands on their take-home pay like the cost of fuel and interest rates.

So, Spur’s business is generally aimed at higher income groups, and its success is a function of their perception of how well-off they are. When times are tight, they cut back on dining out – something which happened earlier this year when Trump decided to start a war with Iran resulting in a sharp increase in the cost of fuel and then later a 25 basis point hike in the level of interest rates.

In our view, the impact of the war in Iran is gradually subsiding. This can be seen in lower price of oil, the rands strength and the fact that the monetary policy committee (MPC) decided to keep interest rates on hold at its most recent meeting on 23rd July 2026. We believe that the oil price will continue to decline steadily over the coming months and years as the world economy adjusts to the new situation and moves more and more towards renewables. In other words, this external shock is really just a “bump in the road” for investors and hence probably represents a buying opportunity.

It their results for the six months to 31st December 2025 the company reported revenue up 8,5% and headline earnings per share (HEPS) up 13,6%. In a trading statement for the year to 30th June 2026 the company estimated that adjusted HEPS would increase by between 5% and 13%. The share trades on a dividend yield (DY) of 6,11% and a price:earnings ratio of 11,26. The DY, particularly is of interest to private investors. Any quality company on the JSE trading on a DY of 5% or more is worthy of your attention.

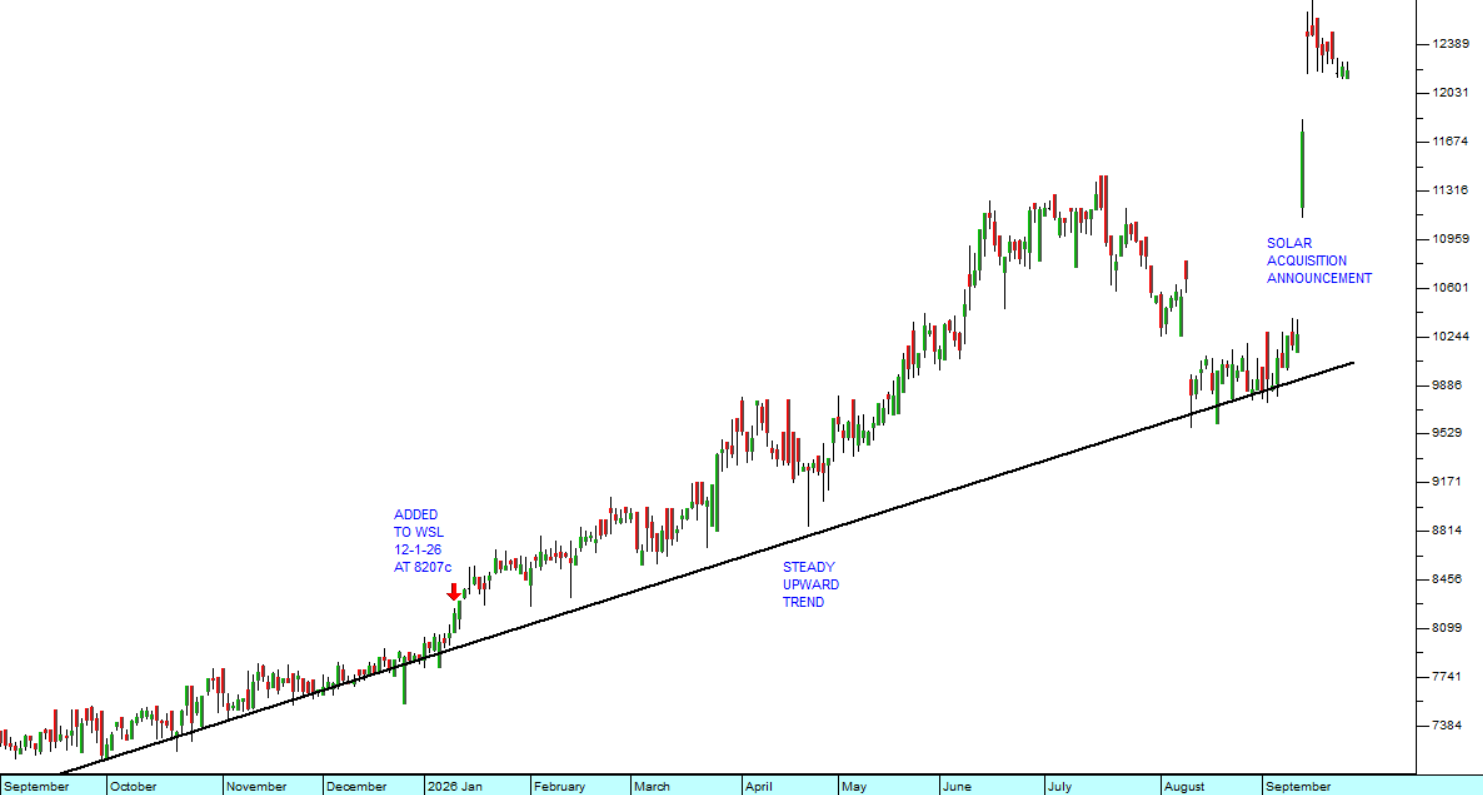
We first added Spur to the Winning Shares List (WSL) on 8th August 2023 at a price of 2488c. Since then, it has been in a steady upward trend paying good dividends which keep growing and maintaining its strong balance sheet. Consider the chart:

Spur (SUR) : June 2023 - 7th of August 2026. Chart by ShareFriend Pro.

We wrote an article about Spur shortly after we added it to the WSL on 16th October 2023 in which we said that we believed that it was “an excellent addition to any private investor’s portfolio”. 

We continue to believe in its long-term investment potential, and we also believe that consumer spending in South Africa will recover as the year progresses and the benefits of our relatively low inflation rate become more apparent.

The Sideways Market  (2026-07-27)

Since its inception in 1960 the JSE Overall index, including dividends, has generated an average compound growth rate of approximately 14,5% per annum in nominal terms. Of course, during that time there have been moments when the index was heavily over-priced – like in October 1987, immediately…

Since its inception in 1960 the JSE Overall index, including dividends, has generated an average compound growth rate of approximately 14,5% per annum in nominal terms. Of course, during that time there have been moments when the index was heavily over-priced – like in October 1987, immediately before the 1987 crash – and moments when it was heavily under-priced like March 1988 immediately after that crash.

Stock market averages or indexes, like the JSE Overall index, over time, always tend to equate to the real growth in the economy - plus the inflation rate. Sometimes investors get overly excited and bid shares up well above their real values and sometimes they become depressed and maudlin, causing shares to fall to record lows. But overall, in the long term, the JSE (and all stock markets around the world) will always go up because of the real growth in their economies and the steady erosion of the purchasing power of paper currencies that we call inflation.

The progress of share market indexes over time could be represented diagrammatically as follows:

Diagram : Market Cycle

The rising straight line represents the real growth of the economy plus the inflation rate, and the curved line shows the theoretical progress of the index through a full cycle. As you can see it fluctuates from being under-priced to being over-priced and back again.

At its lowest point (“A”), after a long downward trend, investor sentiment is balanced between the bulls and the bears (50/50). The negativity of the bears is now being balanced by the realisation that shares are very cheap, and bargain hunters are busy snapping up any loosely held scrip.

As the index begins to move up, sentiment shifts. More and more investors become bullish and there are fewer and fewer bears. Eventually, the index crosses that magical “real value” line (“B”) and the shares become over-priced – but it continues to go up. At this time, about 80% of investors are bullish and only 20% are bearish.  

Eventually, some investors, (the smart money) begin to realise that shares are now over-priced, and they start off-loading their holdings. The point is reached where the bulls and bears are again in balance (“C”) with roughly half of them bullish and the other half bearish (50/50).  

So, what is a sideways market? It is a period when investors as a group are more-or-less evenly divided between the bulls and the bears (i.e. 50/50). For a while neither can gain ascendancy and the index moves sideways. This typically happens at the top and the bottom of the cycle, but it can also happen during the upswing or downswing.

The S&P500 index, for example, right now has been moving sideways since about the end of May 2026 - a period of nearly two months. The shares of the Magnificent Seven have been moving sideways or downwards, but during that time the companies which make up the index have continued to grow and make profits – it is just that investors are worried about where they might go next.

The bears are out in force and there is the added uncertainty of where interest rates might go when the Monetary Policy Committee (MPC) meets again at the end of July. Tesla and Alphabet’s quarterly results were less than wonderful. Investors are suddenly worried about Alphabet’s expected $200bn full-year capex and Tesla’s disappointing profit. And now they are worried about Microsoft, Amazon and Meta which report next.  

Actually, if you consider that Trump has resumed the Iran war and that the Houthis have closed the critical Strait of Bab-el-Mandeb pushing the price of North Sea Brent up to as high as $100, the S&P is doing relatively well. American analysts are calling the market “frothy” or talking about investors “walking on eggshells”.

This does not mean that the upward trend is over or that we are now looking at an impending bear market. It just means that the S&P is pausing to catch its breath after the rapid rise during April and May 2026. Markets never move in a straight line – there are always rallies and corrections and periods of indecision.

In our view, Trump is now facing a terrible dilemma. The November mid-term elections are just 3 months away and his approval rating is disastrous. His traditional MAGA supporters are abandoning him in droves because they really don’t like the high price of fuel. And his bombastic attitude towards the war, which everyone knows he started, is just making the situation far worse. We believe his time is rapidly running out. But we also believe that the AI productivity boom is just beginning and that markets will continue to rise to new record highs. Our view is that the longer this sideways market persists, the stronger will be the upward move when it is finally resolved.    


JSE Top 40

105,635.00 (-1.24%)

All Share

113,323.00 (-1.18%)

Financial 15

26,153.00 (-0.86%)

J200
J203
J212
Top Gainers
# Code Name Close (c) % move
1 SOH S-OCEAN 110 +10.00%
2 TEX TEXTON 307 +9.64%
3 DNB DENEB 246 +6.96%
Top Losers
# Code Name Close (c) % move
1 BAC AFBITCOIN 425 -15.00%
2 SKA SHUKA 63 -10.00%
3 LBR LIBSTAR 355 -8.97%

Top Movers – Charts

Top Gainer: SOH
Top Loser: BAC