S&P500 Market Action
11 December 2023 By PDSNETOn the 20th November 2023, we tweeted that the S&P500 index, after its sharp rise of the previous sixteen trading days, would probably experience some sort of correction. That correction did, in fact, materialise, but the strength of the upward trend and the bullish sentiment present in the market reduced it substantially and it has turned out to be more a period of sideways rather than downward movement.
It is always important to watch the action of the market closely to ascertain the strength or weakness of investor sentiment. The presence of break-away gaps is a sure sign that investor sentiment is very strongly bullish. The flattening of a technical correction into a period of sideways movement is a further indication of bullishness. Consider the chart:
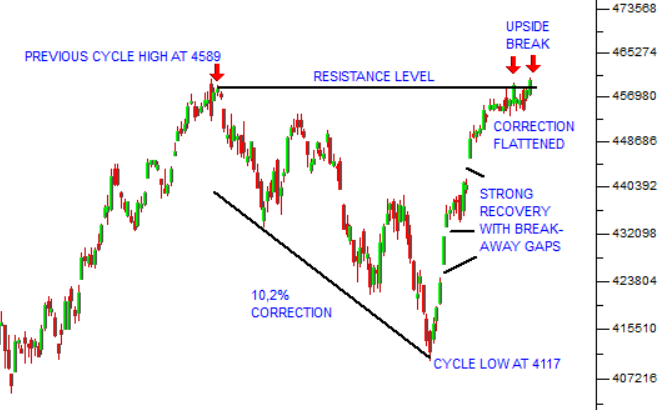
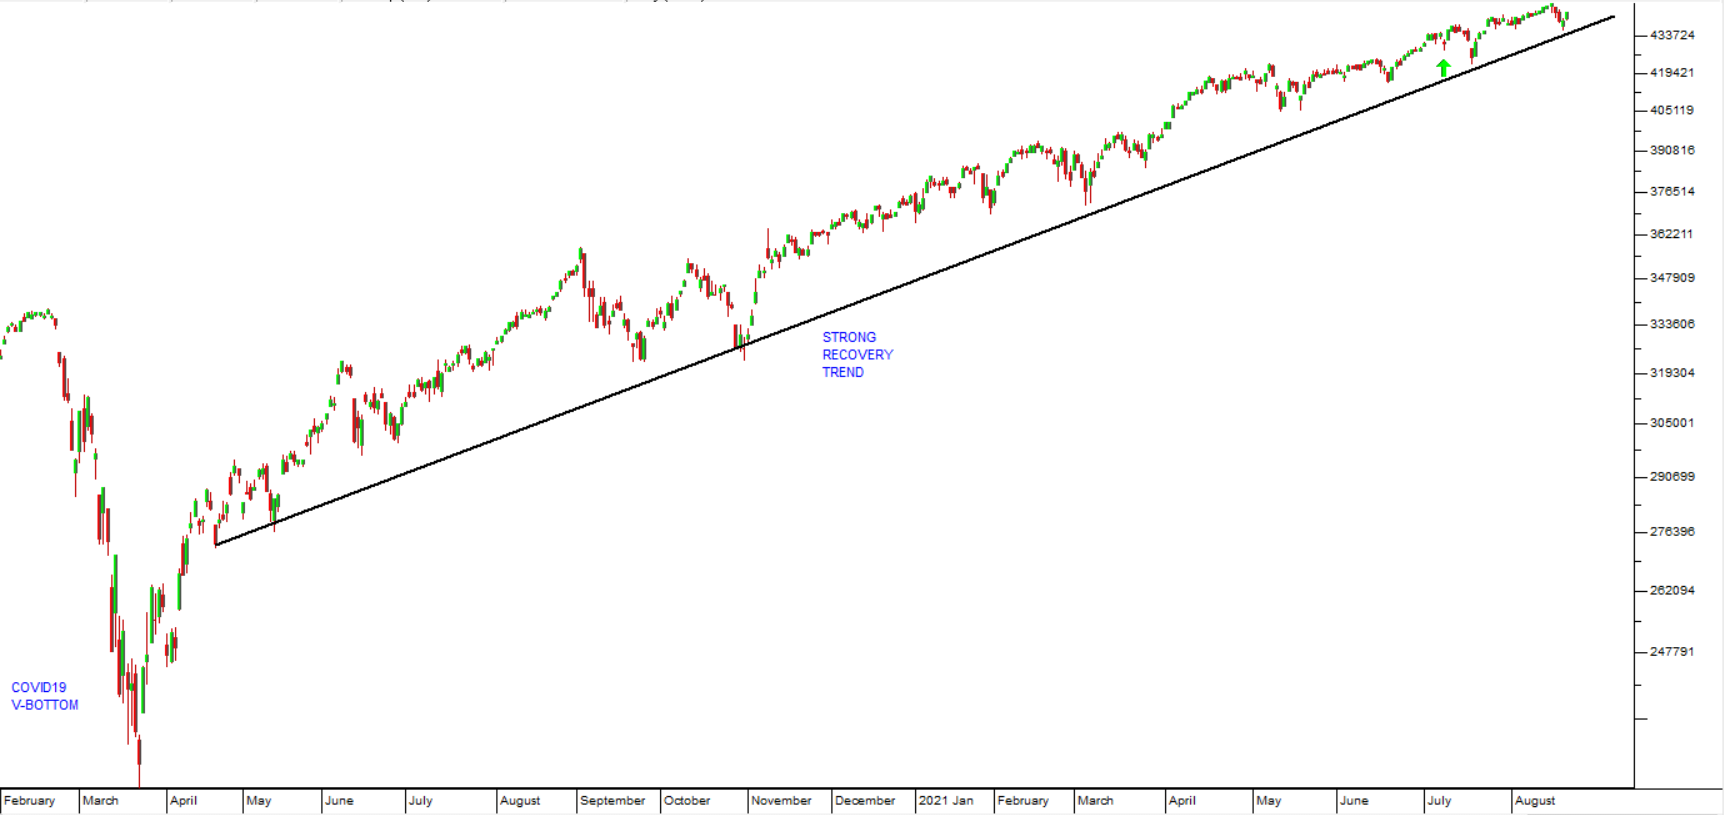
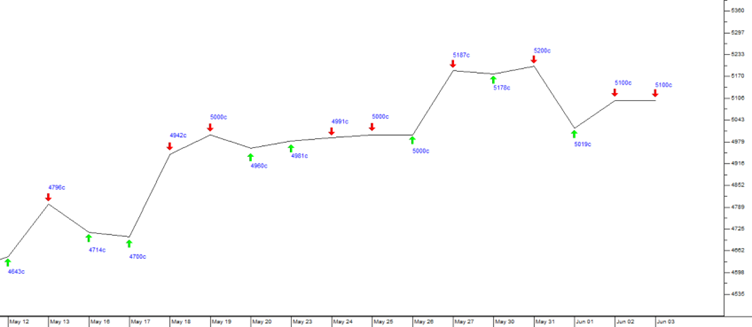
This shows the progress of the S&P since the cycle high at 4589 made on 31st July 2023. The 10,2% correction took the index down to a low of 4117 on 27th October 2023 and then there was a strong recovery with at least three break-away gaps.
The previous cycle high then became a level of resistance – and, as we pointed out in our tweet of 20th November, the market was at that time overdue for some sort of correction. The “correction” of the next thirteen trading days has been very muted – the S&P has hardly fallen at all - showing how dominant bullish sentiment is currently.
On 4th December we tweeted that, despite the expected correction, we remained bullish and that we expected the index to break to a new all-time record high, possibly over the festive season, in a Santa Clause rally.
On Friday the 8th of December the index broke up through the resistance at 4589 closing above the previous cycle high and is now just 4% below the all-time record high of 4796.56 made on 3rd January 2022.
The trigger for the upside break was the US jobs number which came in better-than-expected at 199 000 with the unemployment rate dropping back to 3,7%. These positive numbers were sufficient to allay any fears of an impending recession while, at the same time, not dislodging the general perception that interest rates in America have peaked. Investors are now expecting rates to begin falling from about May 2024, slightly later than before.
As usual, investor sentiment in the US is teetering on a knife-edge. Positive economic news always tends to cause fears of further interest rate hikes, but at the same time it does show that the economy is doing well and that the profits of S&P500 companies will continue to increase.
What is interesting is that, while the S&P500 has been moving sideways, the JSE Overall index has corrected quite sharply, losing almost 3% in the last few days. This is in keeping with its status as an emerging market index. It always tends to be more volatile than the S&P moving further and often faster, both on the upside and the downside.
As the S&P moves above the current resistance at 4589, and especially if it breaks to a new all-time record high above 4796, we can expect the JSE to follow suit – but to go further and faster.
DISCLAIMER
All information and data contained within the PDSnet Articles is for informational purposes only. PDSnet makes no representations as to the accuracy, completeness, suitability, or validity, of any information, and shall not be liable for any errors, omissions, or any losses, injuries, or damages arising from its display or use. Information in the PDSnet Articles are based on the author’s opinion and experience and should not be considered professional financial investment advice. The ideas and strategies should never be used without first assessing your own personal and financial situation, or without consulting a financial professional. Thoughts and opinions will also change from time to time as more information is accumulated. PDSnet reserves the right to delete any comment or opinion for any reason.
Share this article: