Lessons from Transcap
19 February 2024 By PDSNETAs a private investor it is very important that you study what has happened in the past and learn from it. The progress of Transaction Capital (TCP) has provided us with an excellent opportunity to examine and learn from a complete cycle in an institutional favourite share. We can examine the entire cycle and see how to profit from it. In this regard, it is important to understand that roughly 90% of all trades done on the JSE are done by the big institutions - pension funds, unit trusts, asset managers and insurance companies. Consider the chart:
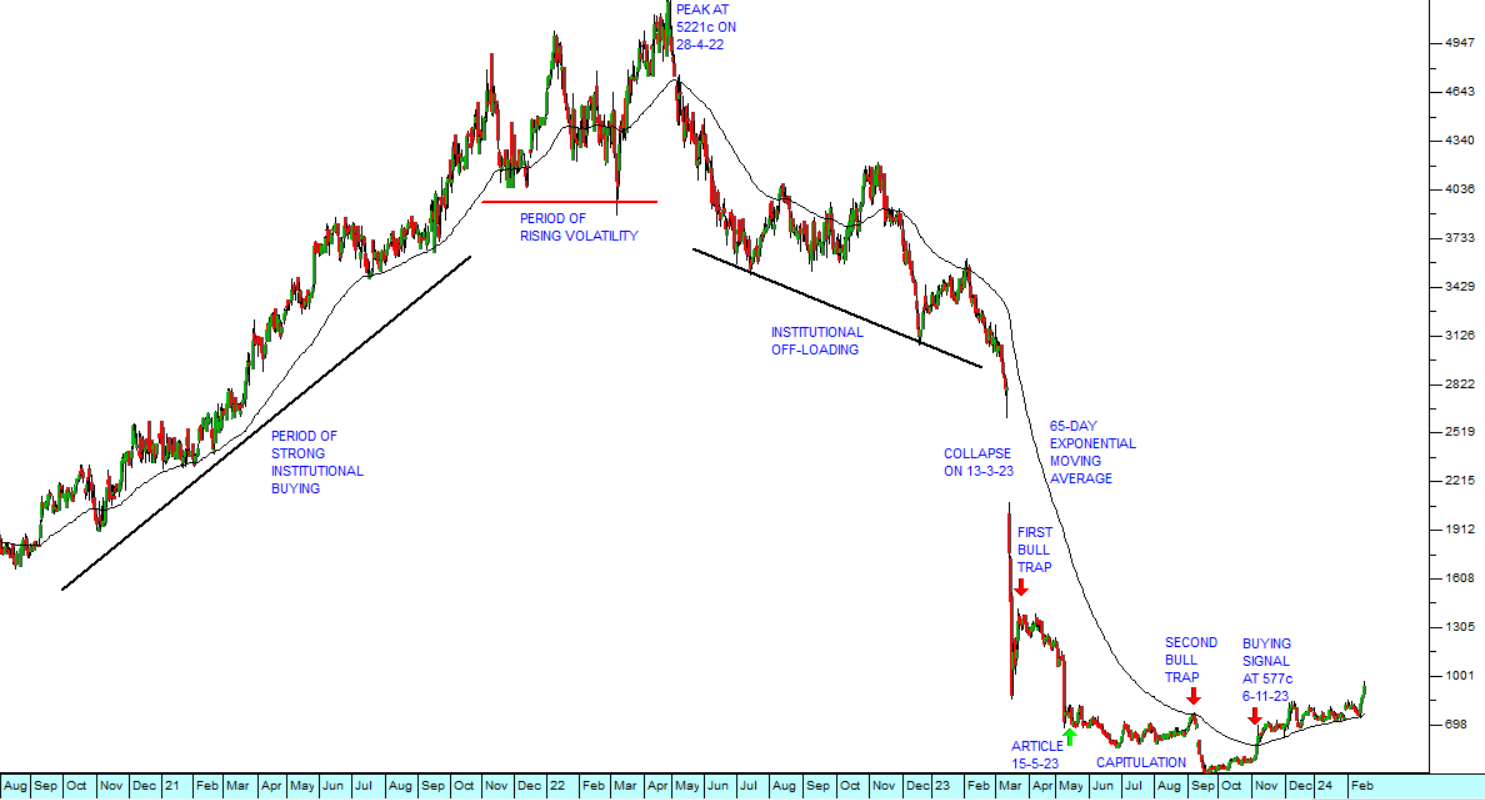
The chart shows the rise and fall of TCP since August 2020. At that time, you may recall, we were still in the throes of COVID-19 and investors, especially the big institutions had identified TCP as an excellent hedge against the pandemic. Strong buying of the share pushed it up steadily to the point where it was fully priced.
That was followed by a period where the share became more volatile as some fund managers became concerned that it was over-priced and reduced their exposure. The share reached a peak on 28th April 2022 at a price of 5221c and began a downward trend.
At first, the downward trend could easily have been mistaken for another correction in the upward trend. But it went much further than a healthy correction. By early June of 2022 the share was down about 20% from its peak - which meant that it had broken clearly down through even the most conservative of stop-loss levels. In other words, as a private investor you should have been out of it long before then.
Then there was period when some fund managers, slowly began to suspect that all was not well at TCP, and they steadily off-loaded their holdings, passing the shares on to less perceptive institutions.
The harsh reality was finally revealed on 13th March 2023 in TCP’s trading statement where they exposed the full extent of the disaster. They predicted that they would make a massive loss in their results for the year to 31st March 2023. The news came as a total shock to many institutions who immediately tried to liquidate their holdings of TCP as quickly as possible. But of course, the market could not absorb such a volume of sell-orders, so the share price collapsed.
The downward trend was brought to an abrupt halt by the first bull trap where some investors, who had difficulty accepting the new reality and saw the share as very cheap, bought in to try and make a quick capital gain. They were wrong and the share continued downward as the full details of TCP’s problems became better known and understood.
The second bull trap came much later, in late August or early September 2023 and was obviously much more considered. Some fund managers began to buy because they believed that the bad news had been fully discounted. This perception was premature and the share fell heavily in September 2023 to reach a point of capitulation on 21st September at its low of 405c.
In our article, TCP - Bad Debt Provision, published on 15th May 2023, we suggested that TCP would not go into liquidation - and that the best strategy was to apply a 65-day exponentially smoothed moving average to the chart and wait patiently for an upside break. That break finally arrived on 6th November 2023 at a share price of 577c. Since then, the share has risen steadily, and it closed last Friday at 940c, giving those who followed our advice a very nice 63% gain in just over three months.
It is important for you to study the different phases of the collapse and subsequent recovery of an institutional favourite on the JSE, because there have been many very similar examples over the years. It is obviously critical to look carefully at the company’s fundamentals and decide whether it will in fact recover in time - or ultimately be liquidated. If you decide, as we did for TCP in May 2023, that the company would survive and recover, then the only remaining question becomes, “When will the share price turn and begin going up?”
The 65-day exponentially smoothed moving average is an excellent mechanism to avoid the inevitable bull traps in a downward trend and then provide a clear buying signal when all the bad news has finally been discounted. To refresh your memory on Types of Moving Averages, refer to our lecture material on this subject.
DISCLAIMER
All information and data contained within the PDSnet Articles is for informational purposes only. PDSnet makes no representations as to the accuracy, completeness, suitability, or validity, of any information, and shall not be liable for any errors, omissions, or any losses, injuries, or damages arising from its display or use. Information in the PDSnet Articles are based on the author’s opinion and experience and should not be considered professional financial investment advice. The ideas and strategies should never be used without first assessing your own personal and financial situation, or without consulting a financial professional. Thoughts and opinions will also change from time to time as more information is accumulated. PDSnet reserves the right to delete any comment or opinion for any reason.
Share this article: