Market Overview
6 May 2024 By PDSNETThis week, the US Federal Reserve Bank’s monetary policy committee (MPC) held interest rates unchanged at their historically high levels and said that they intended to hold rates at these high levels for longer than previously expected. This information was followed by the April 2024 non-farm job creation number which came in at 175 000 – considerably lower than expected and almost half of March’s revised 315 000 figure.
Markets have mostly reacted to these numbers negatively. The bulls on Wall Street have been trying to “buy the dip” for the past ten days in the hope that the correction is over. Despite the strong close on Friday which saw the S&P gain 1,26%, we believe that the correction may not yet be over.
One of the indications is that the drop in the price of oil during this correction on Wall Street is persisting. Oil closed at around $83 on Friday – significantly down on its high of over $91 on 5th April and almost 7% down on the week.
The drop is partly due to the general relaxation of tensions in the Middle East where a ceasefire in the Israel/Gaza war may be imminent. It is also partly due to the fact that the driving season in America is almost over and the demand for fuel usually drops off as the summer holidays come to an end.
The fall in the oil price is good news for the Biden election campaign because it impacts almost all Americans positively – and it is bad news for Russia and Putin who rely on oil revenues to fund the on-going war in Ukraine. Consider the chart of the price of North Sea Brent oil:
_art4mAy24.png)
Here you can see that after making a cycle high at $91.60 on 5th April 2024, the price of North Sea Brent has been falling, culminating in 5 down days last week. The downward trend broke through the upward trendline which has been in existence since December last year and possibly indicates a new downward trend.
Of course, the weakening oil price is very good for South Africa and will help to bring the price of petrol down from its current high levels above R25 per litre. It will also help the rand to continue its current strengthening trend. Consider the chart of the rand against the US dollar:
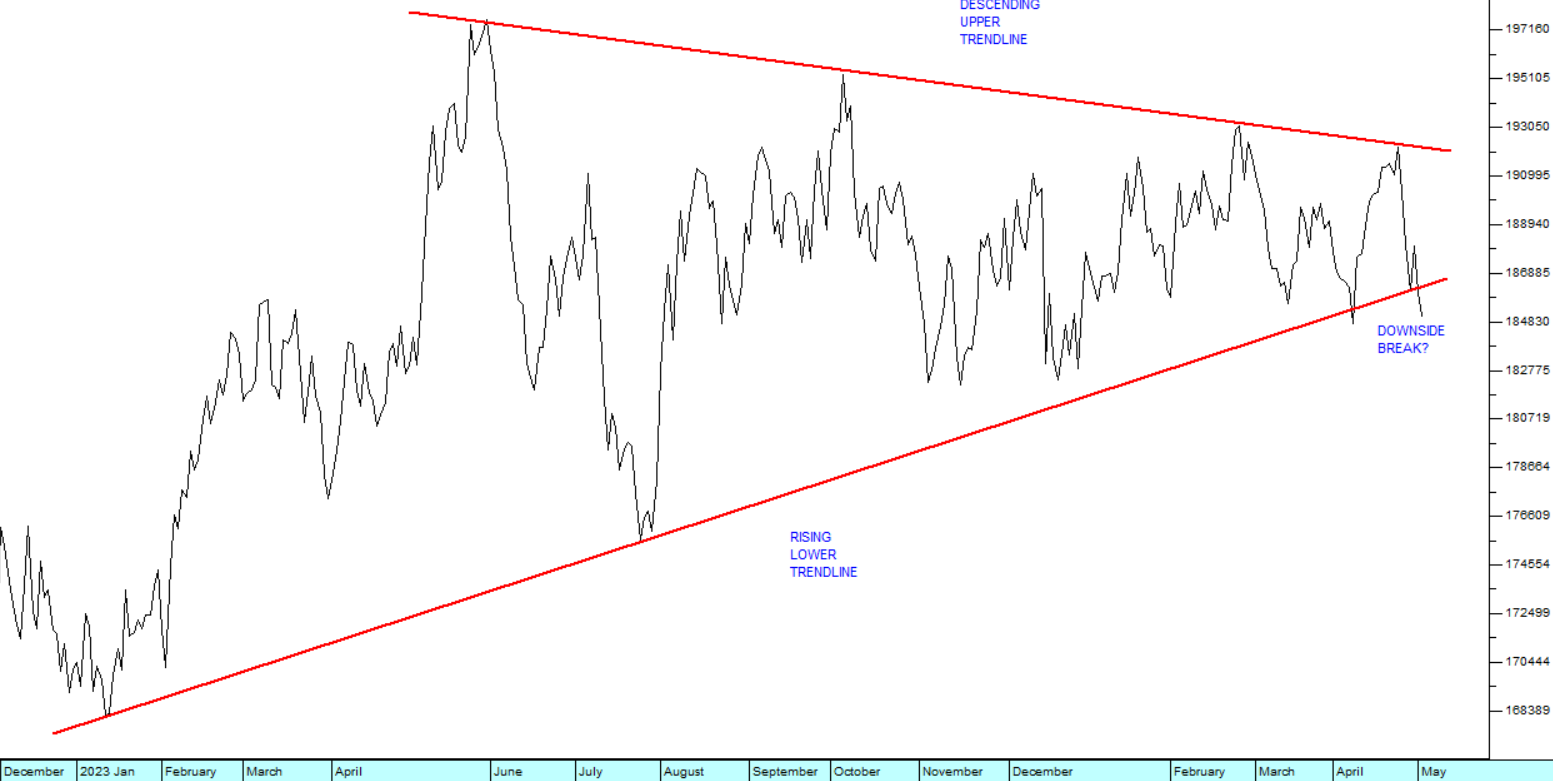
For the past few months, we have been drawing you attention to the fact that the rand/US$ chart has been operating in a classical “triangle” and that sooner or later that formation would be broken, either on the upside or the downside, indicating the future direction.
It now appears that the rand has broken out of the triangle on the downside – which means it is strengthening and should continue to strengthen. There are many possible reasons for this, including:
- A resurgence of risk-on sentiment in international markets as bullish investors find reasons to be optimistic about the progress of US interest rates.
- Optimism that the local elections will soon result in a better, new administration of the South African economy.
- That a possible sustained drop in the price of oil will mean lower outflows and reduced pressure on the rand.
As a private investor you should try to develop a clear and consistent opinion on the future of those major indicators which will impact on the JSE. These include the S&P500, the price of oil and the rand/US dollar exchange rate.
DISCLAIMER
All information and data contained within the PDSnet Articles is for informational purposes only. PDSnet makes no representations as to the accuracy, completeness, suitability, or validity, of any information, and shall not be liable for any errors, omissions, or any losses, injuries, or damages arising from its display or use. Information in the PDSnet Articles are based on the author’s opinion and experience and should not be considered professional financial investment advice. The ideas and strategies should never be used without first assessing your own personal and financial situation, or without consulting a financial professional. Thoughts and opinions will also change from time to time as more information is accumulated. PDSnet reserves the right to delete any comment or opinion for any reason.
Share this article: