Cartrack Vs Mix Telematics
22 April 2020 By PDSNETTwo of the most interesting companies listed on the JSE are Cartrack (CTK) and Mix Telematics (MIX). Both companies are involved in providing remote fleet and asset management systems. Both companies started in South Africa recovering stolen vehicles and both have spread across the world expanding their client base and broadening their product options.
As listed shares, both companies have the distinct advantage that the majority of their income takes the form of annuity income. They also service companies with almost no working capital - which means that their income is fairly secure, even in these difficult times. They also both offer a rand-hedge element.
A comparative relative strength chart of Cartrack against Mix Telematics shows the following:
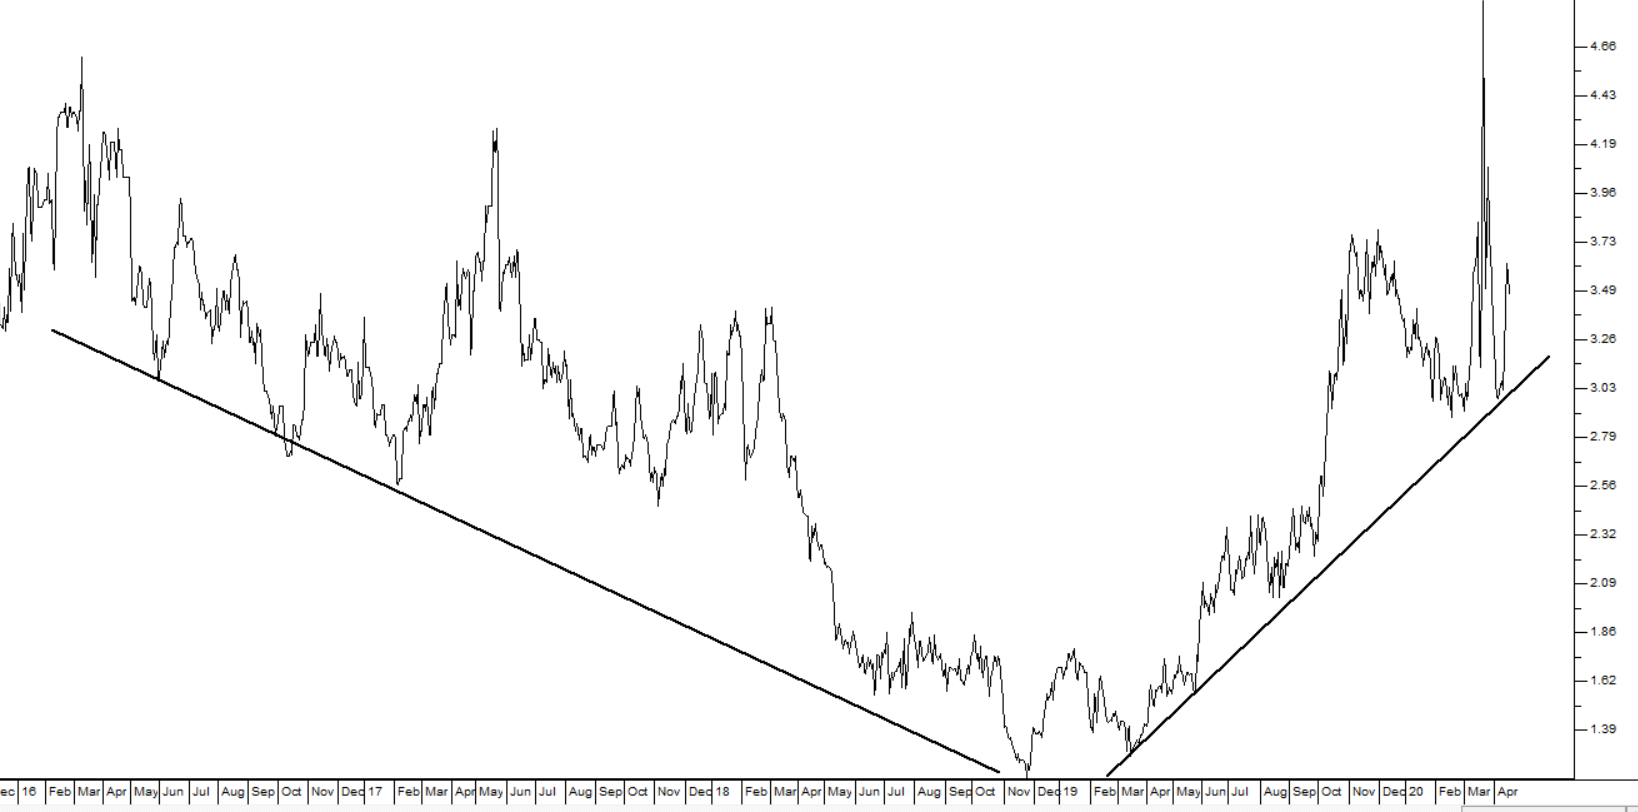
As you can see here, in 2016 to 2018, Mix Telematics was out-performing Cartrack consistently, but since then Cartrack has been doing better.
This is also reflected in the two companies' P:E ratios. Mix Telematics is on a price:earnings ratio (P:E) of 15,98 while Cartrack is on a P:E of over 60.
As a private investor this situation should raise some questions. Why do investors favour Cartrack so much more than Mix Telematics? Is there an opportunity here?
Mix Telematics claims 817000 subscribers with 87% of its income in subscriptions (i.e. annuity income) and an EBITDA margin of 30%.
Cartrack claims 1039000 subscribers with 96% of its income in subscriptions and an EBITDA margin of 51%.
Cartrack trades an average of 24% more in rands per day than Mix Telematics - which perhaps shows that Cartrack is more favoured by institutional investors. Both companies have more than enough liquidity in their shares for private investors.
On paper, Cartrack is out-performing Mix Telematics by a healthy margin although both companies are growing rapidly.
Perhaps the best method of seeing which company offers the best value right now is to look at their price:earnings growth ratios (PEG).
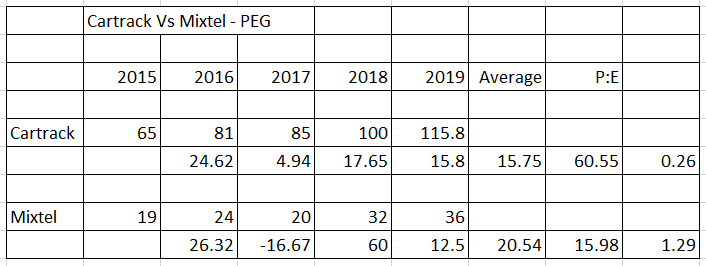
The table above shows the percentage in earnings per share (EPS) of the two companies going back to 2015 and then uses that to calculate their respective PEG ratios.
Surprisingly, Cartrack's average growth in earnings over that 5-year period (15,75%) is noticeably less than Mix Telematics's (20,54%) - a fact which is clearly not reflected in their share prices.
This leaves Cartrack with a PEG of 0,26 while Mixtel has a PEG of 1,29 (if you are not sure about PEG ratios, go to Module 10: P:E and EPS as a Measure of Share Value).
This shows that Mix Telematics offers far more value that Cartrack at current prices and Cartrack looks distinctly over-priced.
Of course, that does not necessarily mean that Mix Telematics shares will do better in the future - but it is certainly a starting point for investigation.
DISCLAIMER
All information and data contained within the PDSnet Articles is for informational purposes only. PDSnet makes no representations as to the accuracy, completeness, suitability, or validity, of any information, and shall not be liable for any errors, omissions, or any losses, injuries, or damages arising from its display or use. Information in the PDSnet Articles are based on the author’s opinion and experience and should not be considered professional financial investment advice. The ideas and strategies should never be used without first assessing your own personal and financial situation, or without consulting a financial professional. Thoughts and opinions will also change from time to time as more information is accumulated. PDSnet reserves the right to delete any comment or opinion for any reason.
Share this article:


