Market View
J200 107,215.00 +0.35% J203 114,850.00 +0.29% J210 122,477.00 +0.24% J211 138,002.00 +1.05% J212 24,610.00 -0.54% J213 143,322.00 +0.40%
Winning Shares (Top 5)
Code Name Added Price Latest % Gain % Gain/Year
SUR SPURCORP 2023-08-08 2488 3800 +52.73% +22.28%
ADH ADVTECH 2023-08-14 1975 3727 +88.71% +37.74%
CGR CALGRO-M3 2023-08-15 356 475 +33.43% +14.24%
CAA CA-SALES 2023-08-25 775 1550 +100.00% +43.09%
CPI CAPITEC 2023-11-04 185496 414250 +123.32% +58.00%
Opinions (Top 5)
Code Name Date Action
SEB SEBATA 2025-12-22 View

Sebata (SEB) is an investment holding company with four divisions - software solutions, water technologies, ICT support services and consulting. Their software solutions division consists of Sebata which offers IT services to municipalities and public entities, Freshmark which provides IT solutions to fresh produce providers, and Rdata which offers an accounting package for the public sector.

Water technologies consists of Utility Systems, electronic water control and pre-payment devices, and Amanzi Meters which supplies water meters to the residential market. ICT support services consists of Turrito Networks, which provides telecommunications and managed solutions to the SME and corporate market, and Dial-a-Nerd, which provides IT support to SMMEs and professionals.

The Consulting division consists of Utility Management Services, which assists municipalities with meter reading and debt management, and Mubesko Africa, which consults to local government supplying draft policies and long-term financial planning. Its market, which consisted primarily of municipalities, is renowned for being badly managed and for failing to pay their debts.

In its results for the six months to 30th September 2024 the company reported revenue of R83,75m and a headline loss of 0,13c compared with a loss of 9,91c in the previous period. In an update for the 3 months to 31st December 2025 the company estimated that its FY2025 results would be published by early January 2026 and the results for the 6 months to 30th September 2025 would follow in a few weeks.

The value traded in the share is around R6 000 per day on average - which makes it impractical even for a small investment. Clearly, it does have some prospects in the UK.

LAB LABAT 2025-12-22 View

Labat (LAB) is a 57% black-owned investment holding company which listed on the JSE in 1999. The company buys and improves subsidiaries and then sells them for a profit. At the moment, Labat has two operations - South African Micro-Electronic Systems (SAMES) and Labat Logistics. On 14th April 2020 the company announced that it had acquired 70% of Biodata, an East London based company that is focused on cannabis healing.

The acquisition is to be paid for in shares. The market for cannabis in South Africa in 2020 is expected to be worth around R27bn. On 5th May 2020 the company issued a profit forecast for the years to 2021 and 2022 - in which it said it was raising R112m by the issue of shares and that it would generate a profit of R60m in 2021 and R162,3m in 2022 resulting in headline earnings per share (HEPS) of 10,9c and 29,9c respectively.

On 8th May 2020 the company announced that it had decided to put Force Fuel into business rescue because of a drop in volumes as a result of COVID-19. In its results for the year to 31st May 2025 the company reported revenue up 310% and headline earnings per share (HEPS) of 13,28c compared with a loss of 3,95c in the previous period.

The company said, "Total Revenue for the year ended 31 May 25 is R198.9m (May 24 R (48.5m). Notable the increased revenue in the technology operations of R160m in the 2025 financial year period. Gross Margin has increased from R24.8m in the 2024 to R117m in the 2025 financial year period, with improvements in each business segment." In a trading statement for the six months to 30th November 2025 the company estimated that HEPS and net asset value (NAV) would increase by more than 100%.

The company's shares were suspended on the JSE in October 2023 and only commenced trading again on 2nd January 2025 with the publication of the interim results to 30th November 2024. Even when trading, this is a volatile, often loss-making penny stock, so investors should be very careful.

It gave an on-balance-volume (OBV) buy signal on 18-12-25. 

SXM SEAM 2025-12-19 View

This is a very thinly traded mining exploration company. It bought two gold projects in the DRC in 2020. In its results for the year to 28th February 2023 the company reported a headline loss per share of 143,34c compared with a loss of 141,76c in the previous period. The company has a negative net asset value (NAV) of 741,36c per share.

In its financials for the six months to 31st August 2024 the company reported zero revenue and a loss for the period of R5m - up from the R3,16m in the previous period. The company has a negative tangible net asset value (NAV). In an operational update on 10th August 2025 the company reported the publication of its results for the year to 28th February 2025 would be delayed until 31st August 2025.

The company said, "Shareholders are advised that the Company's Lapon Plant is currently operational on a limited basis, producing approximately 10% of its full production capacity." In an update on18th December 2025 the company said, "As the AFS remain outstanding and a new auditor has not yet been formally appointed, the Board cannot at this stage provide a definitive date on which the suspension is expected to be lifted." The share is suspended on the JSE. 

JBL JUBILEE 2025-12-18 View

Jubilee Metals Group (JBL) is a diversified metals recovery company which re-processes mine waste and surface materials. It is listed both on the London AIM market and on the JSE's Alt-X. It has operations in South Africa, the UK, Madagascar, and Australia - and it is involved in a joint venture in Zambia to produce lead, zinc and vanadium.

The company primarily produces platinum group metals (PGM) and chrome, and its primary asset is a 63% stake in the Tjate project, which is assessed to include the world's largest undeveloped block of platinum ore with an estimated potential of 65m ounces on the Western limb of the Bushveld Igneous Complex. However, in recent years the company has "...pivoted towards a smelting and beneficiation strategy as a cashflow survival strategy." Jubilee has spending about R154m to consolidate its PGM retreatment business by buying a reprocessing plant and some dumps.

The R154m is being used to buy a chrome processing operation and 1,8m tons of tailings from PlatCro Minerals. It is a low-cost producer, but subject to the vagaries of the platinum and base metals markets. In its results for the year to 30th June 2025 the company reported a loss for the year of $29,76m compared to a profit of $6,39m in the previous year.

The headline loss was 62c (US) compared with a profit of 8c in the previous period. The company said, "The financial year to end-June was one of momentous change for Jubilee Metals. Very soon, the Company will become a pure play copper producer, generating our revenue from an exciting suite of copper growth assets situated on one of the richest copper belts on earth". In our view, this share may be one of the better options in the mining sector but remains highly volatile and risky.

We suggest waiting for a break up through the share's long-term downward trendline. That has not yet happened. On 7th October 2024 the company announced that it had increased its stake in project "G" to 65% and that it had secured an additional 2 megawatts of power from an IPP. 

PSV PSV 2025-12-17 View

This is an Alt-X listed industrial holding company with two divisions - Omnirapid which supplies mining and industrial consumables, and Specialised Services consisting of Cryoshield designs, which manufactures and supplies process control equipment, and Rand Air, which designs and produces vessels for the cryogenic industry. In its results for the year to 28th February 2019, the company reported turnover up 59% and after-tax profit of R1,3m.

The headline loss per share was 7,65c. The company said that Specialised Services performed badly because of the poor economy. The company also said, "Poor execution and structural sector changes in geosynthetic lining material supply and installation resulted in substantial losses." In a trading statement for the six months ended 31st August 2019, the company estimated a headline loss per share of between 1,78c and 2,03c - which compares with the 1,25c loss in the previous period.  On 16th March 2020 the company announced that a decision had been taken to put it into business rescue and the share has been suspended on the JSE since 7th September 2020.

On 26th June 2024 the company said, "DNG applied to the High Court in Johannesburg for leave to appeal against the final liquidation order which application was argued and dismissed on 25 March 2024, and DNG was ordered to pay the business rescue practioner's legal costs." In a quarterly update on 15th December 2025 the company said, "...shareholders are advised that the consideration of the recapitalisation of the Company is still ongoing.

A provisional liquidator was appointed who reached out to DNG Energy Limited's (DNG's) legal counsel to discuss a proposal. The Company has received a letter from the JSE advising of the intention to proceed with the termination the listing of the Company."The share remains suspended. 

Winning Share: SUR
Opinion: PSV
Year-end Overview  (2025-12-22)

The Rand 2025 has been a year of solid progress for South Africa. The government of national unity (GNU) has held together despite dire predictions and the country has implemented a number of notable economic reforms. At the same time, international investment sentiment has shifted firmly towards…

The Rand

2025 has been a year of solid progress for South Africa. The government of national unity (GNU) has held together despite dire predictions and the country has implemented a number of notable economic reforms. At the same time, international investment sentiment has shifted firmly towards “risk-on” and the US dollar has lost significant ground against other first-world currencies.

The effect of these developments has been that in the last 8 months the rand has appreciated from an intra-day high of R19.93 on the 9th of April 2025 to the US$ to current levels around R16.75 – a gain of 16%. Consider the chart:

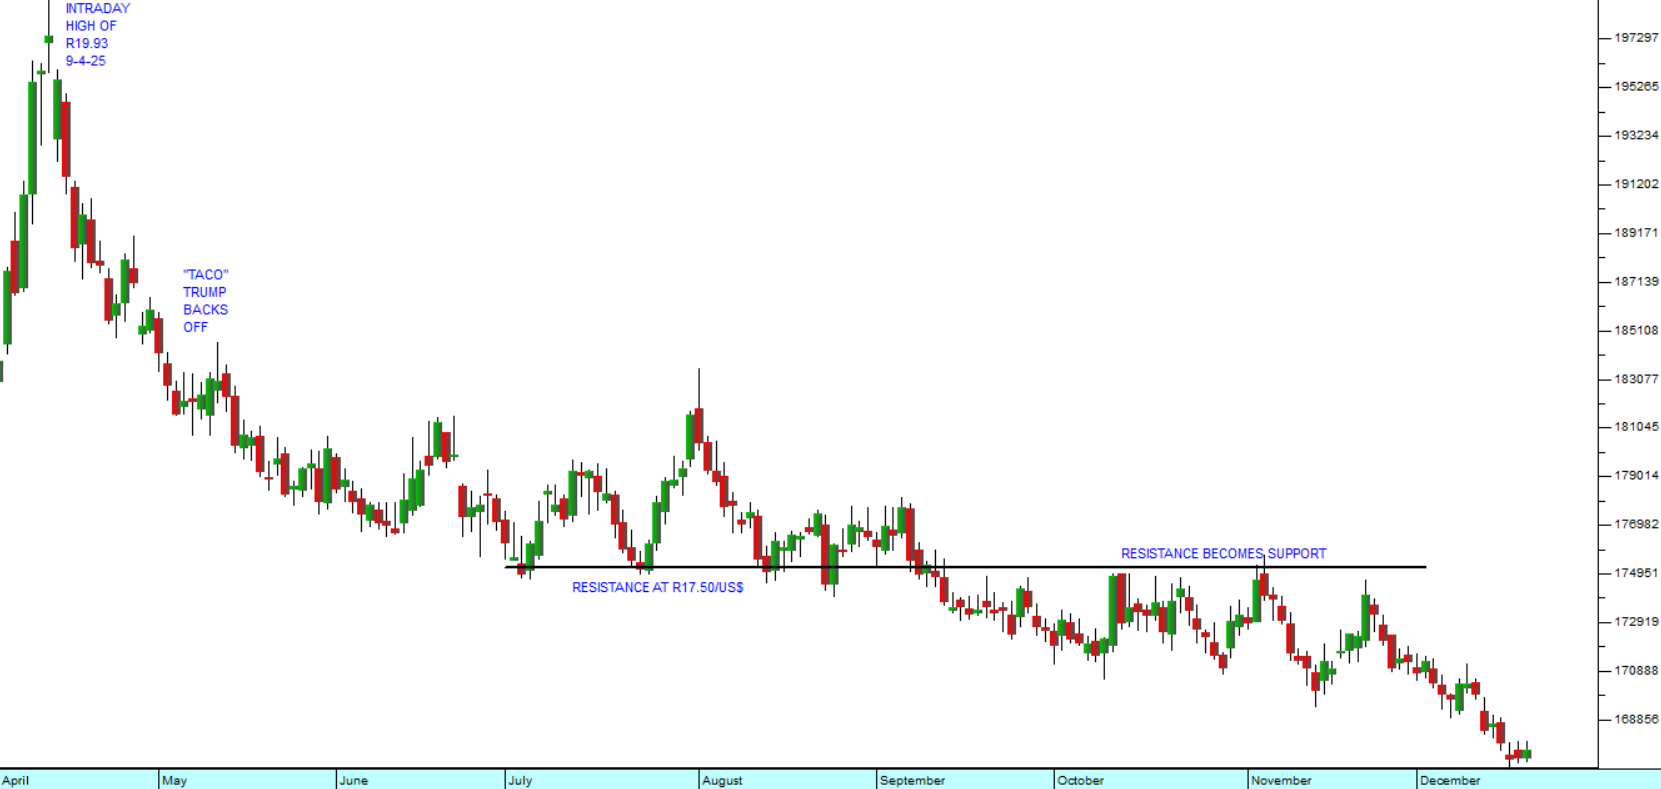
South African rand/US dollar : April 2025 - 19th of December 2025. Chart by ShareFriend Pro.

Combined with the falling oil price, this is having the effect of reducing the price of fuel in the country rapidly – and that has resulted in sharply lower inflation. The drop in inflation means that consumers are seeing an increase in the level of their real incomes and they have been paying off debt and spending more. In our view, the rand will continue to hold its value against other hard currencies and to appreciate against the US dollar.

Oil and Ukraine

The price of oil has continued to fall, with North Sea Brent dropping below $60 for the first time since February 2021. This decline reflects the steady movement of the world away from fossil fuels and the rapid implementation of alternative energy installations, especially solar power. We expect this trend to continue and even accelerate as the cost of solar power continues to become more efficient and more affordable.  

The price of Urals crude has fallen even further than Brent and it now trades for less than $35 per barrel. This is a direct consequence of the Ukrainian attacks on Russia’s shadow fleet both in the Black Sea and even in the Mediterranean. Together with their on-going destruction of Russia’s oil infrastructure, these attacks are rapidly eroding Russia’s ability to finance the continuation of the war.

At the same time, Ukraine has recently secured a pledge for a further 90bn euro loan from the European Union to continue paying for the war for at least the next two years. To us it seems impossible for Russia to continue funding this war under these conditions and we anticipate some sort of resolution of the situation in the fairly near future – probably next year.

The S&P500 Index

Wall Street remains firmly in a long-term bull trend, but has been moving more-or- less sideways since the beginning of October 2025. There has clearly been some rotation out of high-tech and especially AI shares into the broader market. Consider the chart.

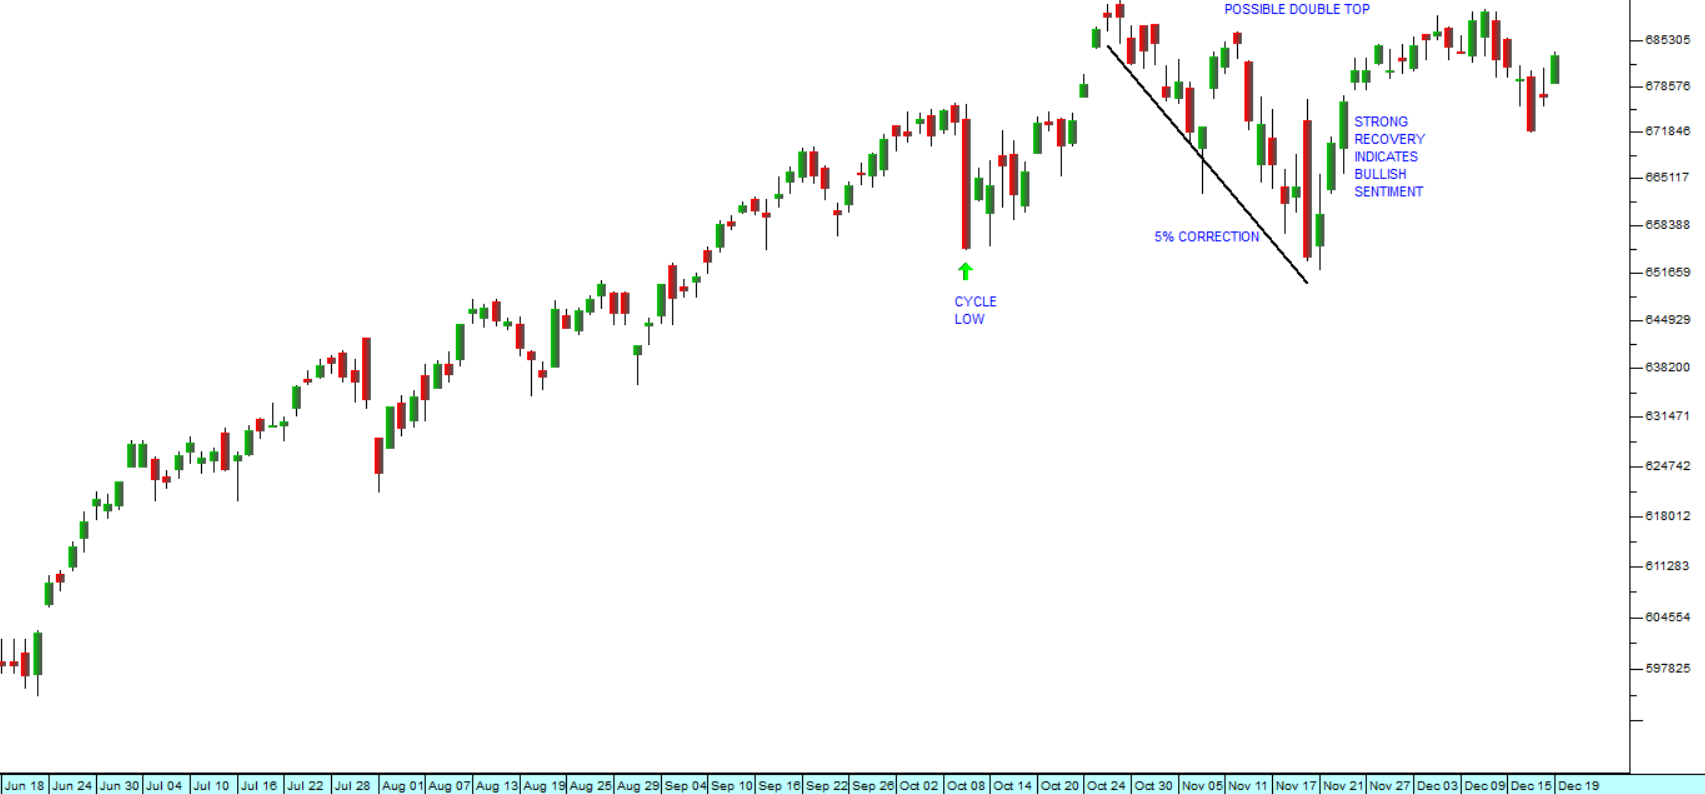
S&P500 Index : 18th of June 2025 - 19th of December 2025. Chart by ShareFriend Pro.

The recent 5% correction in November took the S&P down to the cycle low of 10th October, where it found support. There was a very strong recovery from this level culminating in a new all-time record closing high at 6901 on 11th December 2025. Then the rotation and profit-taking began.

Technically, there is a possibility that what we are looking at is a double top formation with the highs on 29th October and then on 11th December. Our view is that this represents some resistance at the 6900 level and in time the market will recover and break convincingly above this level. The latest inflation and jobs figures coming out of America indicate that the economy is still performing well – albeit more slowly than it has been. There is still room for further interest rates cuts with inflation apparently well under control.

The staff and directors at PDSnet take this opportunity to wish you and your family all the best for the Festive Season and the New Year.

Please note: Our next article will be published on 12th January 2026.  

The Demise of Bitcoin  (2025-12-15)

Why is the Bitcoin price falling when the price of gold is rising?Cryptocurrency doyens always claim that Cryptos are somehow a hedge against the impending weakness of paper assets – and especially the US dollar. But our observation is that Bitcoin is more of a risk-on asset than a risk-off asset…

Why is the Bitcoin price falling when the price of gold is rising?

Cryptocurrency doyens always claim that Cryptos are somehow a hedge against the impending weakness of paper assets – and especially the US dollar. But our observation is that Bitcoin is more of a risk-on asset than a risk-off asset. When risk-averse investors run for cover, they don’t switch to Bitcoin. Rather they switch out of Bitcoin and into gold.

Cryptocurrencies and gold are the same in that neither one of them offers the investor any kind of income or return. Your Krugerrands and your Bitcoin don’t pay you any interest, rent or dividends. So, neither of them can really be seen as an investment in any true sense. Both owe their value to investor belief and to their relative scarcity.

The difference is that almost everyone throughout the world believes in the value of gold, while only a very small, relatively esoteric, group of passionate protagonists (like Elon Musk) and their followers believe in the value of Bitcoin.

The simple truth is that your Krugerrands can be bought and sold in any country throughout the world. From the humblest coin dealer in the backstreets of Shanghai to the sophisticated halls of London’s Threadneedle Street, one ounce of gold is immediately recognised and highly valued. At the same time, the value of a Bitcoin is volatile and the subject of endless debate. Gold has been sought after and valued for more than five millennia, while Bitcoin has only been around for just over 15 years.

Elon Musk warns that the US government debt is eventually going to result in a collapse of the US dollar and hence a massive increase in the price of cryptos. While we agree that the US dollar is weakening and has been for most of this year, over the long term it has held its value. For example, in April 1990, the US dollar bought you 160 Japanese yen and today it buys you 155,8 yen. In May 2003, one US dollar was worth about 87 euro cents. Today it is trading for 85.40 euro cents.

In 1987 economists and investors were very concerned about the level of debt in America as the US government's borrowing reached $3 trillion and they warned of the imminent collapse of the economy. Today, 38 years later, the US national debt is $38,74 trillion and rising rapidly.  The same experts and fear-mongers are again warning of the economy’s imminent demise.

Certainly, the US budget deficit is a concern, but we do not believe that it portends the collapse of the US economy any time soon. In our view, the US economy is being supported by the massive productivity benefits which are flowing from new technologies and particularly the spread of AI through the economy.

The Bitcoin price has itself collapsed over the last 10 weeks from its peak of $125265 to current levels of around $90 000 and it has been as low as $83268 (21-11-25). That’s a fall of 33,5%. Consider the chart:

Price of Bitcoin in US dollars : 3rd of July 2025 - 12th of December 2025. Chart by ShareFriend Pro.

The Nobel prize-winning economist, Professor Paul Krugman, suggests that the fall of crypto prices is directly linked to fall in Trump’s influence and power in America. He may well be right. There can be little doubt the Trump and MAGA movement have suffered some significant set-backs this year and that the excitement that his return to the White House created for cryptocurrencies has abated. There can also be little doubt that the big players are getting out of Bitcoin or as Krugman puts it, “...the Trump trade is unwinding”.

The rapid rise of the gold price since March 2024 definitely indicates that big international investors are worried about the future of paper assets. Why else would they give up the interest which they could earn on government Treasury bills and put their wealth into gold? But perhaps, instead of a collapsing US economy, they are seeing the inevitable inflation which will result from a world economy that is moving into a powerful boom phase, driven by rapidly increasing productivity levels.

Perhaps the only lesson we can learn from all of this is that cryptos are not in any sense a hedge. Rather, they are a rich man’s speculative plaything – to be abandoned whenever belief levels falter. And Musk’s economic opinions are about as reliable and consistent as his political opinions. He is undoubtedly an engineering genius – but that does not automatically make him an expert in social media, politics or economics.


The Collapse of the Dollar  (2025-12-08)

The currency of a country is like the shares of a company. If a company is expected to do well and make profits, then its shares will rise and vice versa. The same is true of a currency. If the country’s economy is expected to do well and create strong growth, then its currency will appreciate…

The currency of a country is like the shares of a company. If a company is expected to do well and make profits, then its shares will rise and vice versa. The same is true of a currency. If the country’s economy is expected to do well and create strong growth, then its currency will appreciate against the currencies of other countries – and vice versa.

The problem is, of course, that because the US dollar (US$) is the dominant world currency, everything gets measured against it, so if the US$ itself is falling rapidly (as it is) then it becomes difficult and misleading to use it as a benchmark currency.

But what else can we use? We need a currency that holds its value through thick and thin - something that will retain its value despite tariff wars, and the various unpredictable exigencies of the modern world economy. There is only one reliable benchmark – gold.

Throughout history, gold has always retained its purchasing power. One ounce of gold today will buy you the same number of cattle or chickens that it would have bought you 5000 years ago in Egypt. The effective purchasing power of gold has never really changed much. Currencies may come and go, get stronger or weaker, but gold is the ultimate asset against which they can and must all be measured.

OIL

For example, we all know that the oil price has been falling. On the 8th of March 2022 one barrel of North Sea Brent oil would have cost you $125.95 and today that same barrel would cost you just $63.76c – a fall of almost 50% - but in US dollars. During the same time period the price of gold in US dollars went from $2056.82 to where it is today - $4214.74. In other words, against the benchmark of gold, the US$ lost 51.2% of its value. This means that the price of Brent oil, in terms of gold, has actually dropped by a whopping 71.7%. This perhaps explains Putin’s true dilemma. In terms of gold the value of Urals crude has almost disappeared completely.

BITCOIN

We can do the same exercise with Bitcoin over the same time period. On the 8th of March 2022, one Bitcoin was trading for $38 697.27 and today, despite its massive fall over the past two months, the same coin is worth $88538.48 – a gain of 128.8%. And the crypto bulls could take some comfort from that – until they adjust for the fall of the US dollar over the same time period. In terms of gold, one Bitcoin was worth 18.80 ounces of gold on the 8th of March 2022 and today it is worth 21 ounces – a gain of just 11.7%.

WALL STREET

And what of the S&P500 index? We all know that Wall Street is in a primary bull trend and has been for 16 years. Beginning again on the 8th of March 2022, we see that the S&P closed on that day at 4170.7 and today it is at 6870.4 – a gain of 64.7%. But if we consider how much it has moved in terms of gold, we find that it is actually down 19.6% over that same time period. Consider the chart:

Comparative relative strength : S&P500 Index/Price of gold in US dollars - July 1996 - 5th of December 2025.

This is a comparative relative strength indicator (CRSI) chart of the S&P500 index divided by the US dollar price of gold. It shows that, in terms of gold, the S&P500 in fact peaked on the 28th of March 2000 at 6.03 ounces of gold - and that today it is trading for just 1.63 ounces – a 73% fall. The chart also shows that from the 8th of March 2022 it has been falling fairly steadily.

This type of analysis paints a very different picture from what we are used to - and one which you may find quite shocking. But of course, when you invest in the share market you buy and sell your shares for rands – and if you are successful, you make a profit in rands. The same applies to investors on Wall Street. Irrespective of what is happening to the value of the US dollar, their profits are still real in terms of the currency that they are using.

What you can learn from this is that gold is the constant. The gold price does not go up and down. Currencies, stock markets, bonds, cryptos and all paper investments go up and down against gold. The real value of gold hardly changes from one millennium to the next.

Since the beginning of this year, the United States dollar (US$) has been falling against the currencies of other countries indicating America’s general decline as the world’s leading economy and super-power. Since the beginning of the year alone, the US dollar has fallen 12.2% against the euro. On the 9th of April this year it took R19.93 to buy one US$. Today you can buy one for R16.96 – which means that the US$ has fallen almost 15% against the rand in just 8 months.

CRSI used in the chart above is a very simple indicator – it is calculated by dividing one data stream by another and then charting the result. You can use the CRSI to chart anything in terms of the gold price or to chart anything in terms of anything. It simply divides one data stream by another and then draws a graph of the result.  

JSE Top 40

107,215.00 (+0.35%)

All Share

114,850.00 (+0.29%)

Financial 15

24,610.00 (-0.54%)

J200
J203
J212
Top Gainers
# Code Name Close (c) % move
1 VIS VISUAL 4 +33.33%
2 ACT AFRO-C 136 +16.24%
3 EUZ EUROMET 94 +16.05%
Top Losers
# Code Name Close (c) % move
1 PMV PRIMESERV 250 -16.39%
2 CCC CILOCYBIN 200 -11.89%
3 ACL ARCMITTAL 110 -11.29%

Top Movers – Charts

Top Gainer: VIS
Top Loser: PMV