There are generally two types of risk in the share market – the risk that a specific share which you have bought falls known as unsystematic risk, and then the risk that the market as a whole falls and drags all your shares down with it - known as systematic risk. The systematic risk that the market is in or about to enter a bear trend is obviously a vital consideration for the private investor. During a bear trend about 80% (or more) of shares will fall while only 20% will rise. This means that from a purely statistical point of view it is better for private investors to stay out of the market during bear trends.
It is also very important to be able to distinguish between a correction (which is often a buying opportunity) and a bear trend. The safest approach is always to always buy shares which are rising, in sectors which are rising in a market which is rising. At the same time keeping a strict stop-loss strategy is vital to protect the bulk of your capital. As a private investor you should have an absolute rule that you never lose more than 15% on any share market investment – ever – and that should include your dealing costs. This can only be achieved if you buy free-dealing shares and always adhere to a strict stop-loss strategy.
Today, Monday 19th October 2026 is the exact anniversary of the greatest single day crash in stock market history. Thirty nine years ago, on Monday 19th October 1987, Wall Street collapsed. The S&P500 index fell more than 20% in the day. Other famous bear trends have also begun in October month, including the infamous 1929 crash, the bear trend of the year 2000, the 2008 sub-prime crisis, and the bear trend of 2022 associated with the Ukraine War. So, October month has a bad reputation with investors, and they generally heave a sigh of relief when it is over.
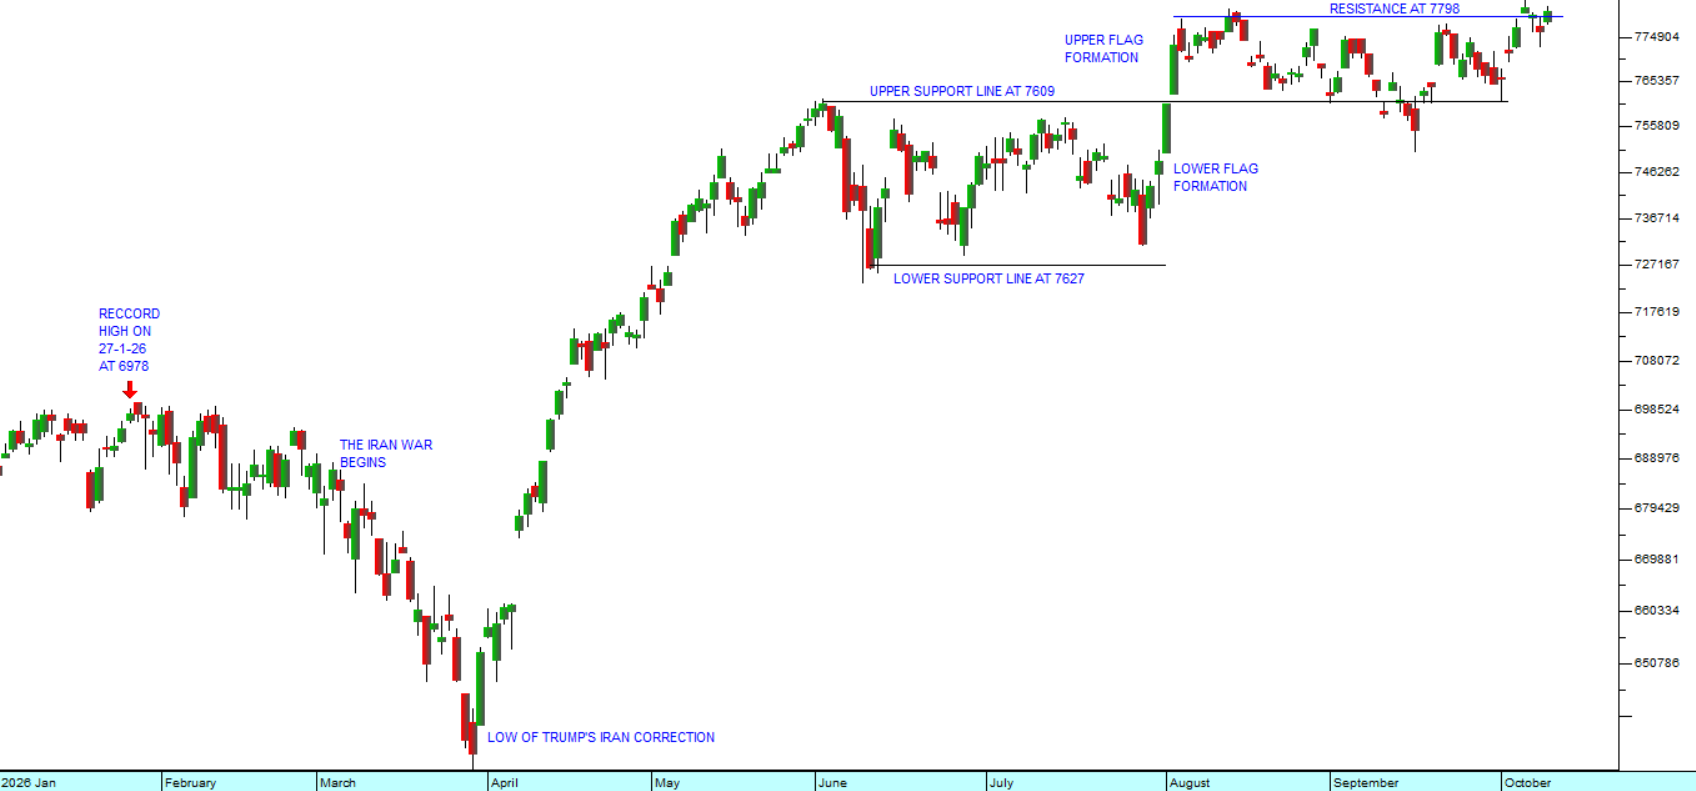
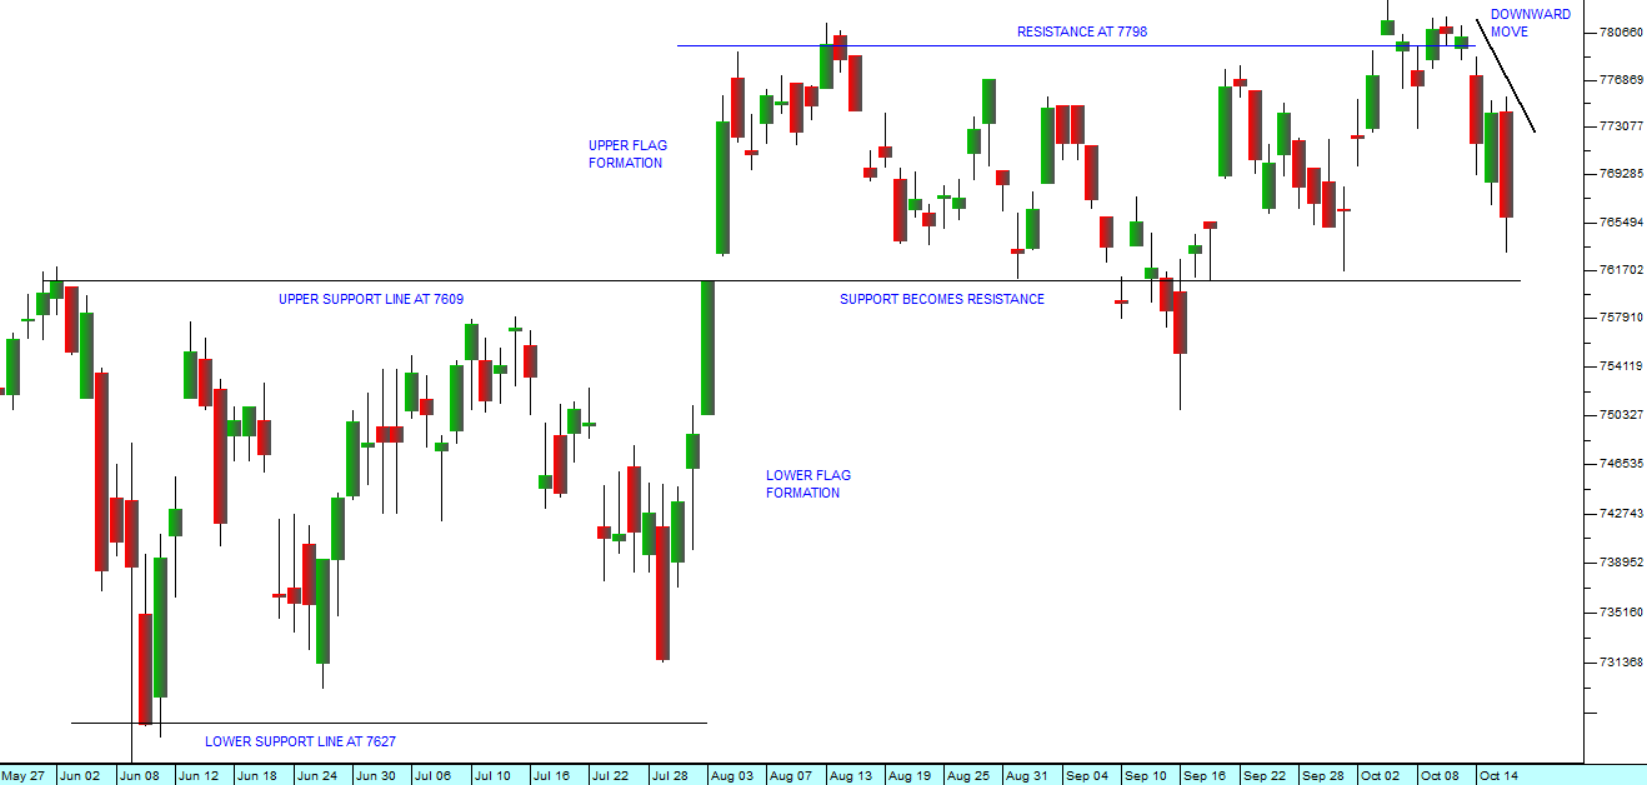
Ominously, Wall Street has been falling over the last week as the Iran war flared up again, pushing the price of North Sea Brent up to nearly $110 per barrel. Consider the chart:
 S&P500 Index : 27th of March 2026 - 16th of October 2026. Chart by ShareFriend Pro.
In our analysis, we have drawn your attention to the fact that the S&P500 index has been moving through two sideways markets or flags as the countervailing forces of the rising oil price and the profitability of the artificial intelligence (AI) revolution play out.
The climb in the fuel price is causing a re-evaluation of inflationary risks throughout the world, but especially in America, where the price of petrol has remained stubbornly above $4 per gallon and diesel has hovered above $6 per gallon. With the mid-term elections just weeks away, Republicans and especially Trump are facing a barrage of criticism for their handling of the economy. The Iranians on the other hand are doing everything in their power to keep the oil price at high levels to put the maximum pressure on Trump.
What is notable is that the high oil price appears to be having less and less impact on Wall Street as time goes by. When Trump and Netanyahu began their war with Iran the S&P fell back sharply to 6611 on the 6th of April 2026, and the price of Brent oil went above $110 per barrel. Today Brent is again hovering close to those levels and the S&P has recently managed to reach a new record high at 7818. The world has been facing increased levels of inflation, rising interest rates, and record bond yields - but despite that, AI and corporate profits continue to take the market higher.
In our opinion, as soon as October month is safely behind us and especially if the mid-term elections have the effect of reducing Trump to a lame dog president, we can look forward to a Christmas rally in the S&P500 during the festive season and into next year. As usual, we strongly advise you to be vigilant and to maintain your stops.